
市场资讯及洞察

5 月伊始,联邦基金目标利率区间维持在 3.50% 至 3.75%。美联储刚刚结束了 4 月 28-29 日的议息会议,投资者正进入一个政策真空期,直至 6 月 16-17 日的下一次决议。然而,地缘政治背景远非平静。由于伊朗冲突导致霍尔木兹海峡处于事实上的关闭状态,布伦特原油价格已飙升至每桶 108 美元附近,国际能源署将其描述为“史上最大的能源供应冲击”。
本月的宏观矛盾既直接又令人不安:由能源驱动的通胀脉冲,正撞上 3 月份表现意外强劲的劳动力市场,而第一季度的增长数据却依然疲软。这种带有“滞胀”色彩的组合拳,直接挑战了美联储目前的政策路径。
美联储此前已将 2026 年 PCE 通胀预期上调至 2.7%,并继续暗示年内仅有一次降息,尽管市场对具体的降息时点仍持有异议。由于 5 月没有 FOMC 议息会议,每一项重磅数据的发布都将比往常承载更多的权重,成为投资者博弈 6 月政策走向的关键筹码。
经济增长:业务活动与需求
步入 5 月,经济增长的前景表现不一。第一季度 GDP 初步预览值已于 4 月 30 日公布,而此前疲软的零售销售和库存数据,使得整体需求端的局势变得更加难以捉摸。
ISM 制造业指数一直是乐观情绪的一个低调来源,近期的数值始终维持在扩张区间。然而,逆风的来源正在发生变化:能源成本和关税效应目前是决定业务活动下一步走向的最关键变量。对于那些已经在应对高昂投入成本的企业来说,108 美元的油价与贸易摩擦的结合,将是对企业韧性的一次重大考验。
劳动力:非农与就业数据
4 月的就业形势报告是本月最集中的风险事件之一。尽管 3 月非农数据强于预期,但此前的修正值使得整体趋势显得有些模糊。4 月的数据将起到决定性作用:揭示劳动力市场是在高利率背景下真正实现了“再加速”,还是仅仅在消化季节性噪音。
通胀:CPI、PPI 与 PCE
4 月的通胀数据是本月对市场影响最大的板块。3 月消费者价格指数 (CPI) 同比上涨 3.3%,其中能源成本月度上涨 10.9%,汽油价格飙升 21.2%,贡献了整体涨幅的近四分之三。鉴于布伦特原油在 4 月下旬维持在 105 至 108 美元之间,能源成本进一步传导至 4 月 CPI 几乎已成定局。尽管整体通胀数据引人注目,但核心 CPI 和核心 PCE 依然是研判美联储底层通胀趋势的关键指标。
政策、贸易与企业盈利
由于 5 月没有 FOMC 议息会议,政策关注点将转向美联储官员的讲话以及备受瞩目的领导层更迭。美联储主席杰罗姆·鲍威尔的任期将于本月中旬结束。唐纳德·特朗普总统已提名 凯文·沃什 (Kevin Warsh) 为下一任主席,市场正密切分析其听证会内容,以寻找央行独立性或政策倾向是否会发生转向的蛛丝马迹。
在地缘政治方面,已进入第九周的伊朗冲突仍是最大的宏观尾部风险。霍尔木兹海峡的封锁和停滞不前的美伊谈判为能源价格设定了较高的底部支撑。同时,第一季度财报季进入高峰期,预计 5 月 7 日将是报表发布最密集的一天,市场将重点关注零售和周期性行业如何应对利润率的挤压。
本月核心监控清单
- 美伊谈判: 关注霍尔木兹海峡运行状态的任何进展。
- 美联储语调: 官员在会议间隙期辞令的任何细微转变。
- 盈利质量: 尤其是零售、能源及周期性行业的表现。
- EIA 原油库存: 通过周度数据衡量国内供应缓冲情况。
- 关税公告: 任何可能推高通胀预期的贸易摩擦信号。
核心总结 (Bottom Line)
绝不能因为 5 月没有议息会议就认为这是一个平淡的月份。在 6 月决议之前,非农、CPI、PPI 和 PCE 数据将悉数出炉,而原油依然是主要的外源性冲击。对于市场而言,核心问题在于:我们面对的是一次暂时的能源驱动型通胀上升,还是在增长放缓的同时出现了一个更广泛的系统性通胀问题?这一区别将决定债券、美元、黄金及股指的下一个大级别走势。


Lululemon athletica inc. (NASDAQ: LULU) announced Q4 and full-year earnings results on Wednesday. World’s second largest sporting goods company reported revenue of $2.772 billion for the quarter (up by 30% year-over-year or 33% on a constant currency basis) vs. $2.701 billion estimate. Earnings per share (EPS) also topped analyst expectations at $4.40 per share (up by 30.5% year-over-year) vs. $4.259 per share expected.
Full-year revenue reported at $8.1 billion (up by 30% vs. 2021), EPS at $10.07 per share. Lululemon expects revenue of $1.890 billion to $1.930 billion for Q1. EPS expected to be between $1.93 to $2.00 for the quarter.
CEO and CFO commentary "In the fourth quarter and full year 2022, we delivered strong results across the business driven by our innovative products, powerful guest experiences, and strategic market expansion. Our continued high level of performance is a reflection of the hard work and agility of our incredible teams and the deep connections they create with our guests and communities around the world. As we enter 2023, we look forward to another year of strong momentum across the globe and delivering on our Power of Three ×2 growth plan," Calvin McDonald, CEO of the company said in a press release.
Meghan Frank, CFO of Lululemon also commented on the latest results and delivering for its shareholders: "We are pleased with our performance in the fourth quarter, which remained balanced across product category, channel, and regions. Our ability to exceed our annual revenue target in a dynamic operating environment is a testament to the enduring strength of the lululemon brand. Looking ahead, we remain optimistic regarding our ability to deliver sustained growth and long-term value for all our stakeholders." The latest results had a positive impact on the stock price.
Shares were up by +12.72% at the end the trading session on Wednesday at $360.87 a share. Stock performance 1 month: +16.66% 3 months: +16.86% Year-to-date: +12.69% 1 year: -4.21% Lululemon price targets TD Cowen: $500 Baird: $425 B of A Securities: $410 BMO Capital: $340 Credit Suisse: $420 Stifel: $460 Wells Fargo: $425 Guggenheim: $440 Citigroup: $440 Telsey Advisory Group: $425 Keybanc: $390 Barclays: $368 JP Morgan: $430 Lululemon athletica inc. is the 358 th largest company in the world with a market cap of $46.03 billion, according to CompaniesMarketCap. You can trade Lululemon athletica inc. (NASDAQ: LULU) and many other stocks from the NYSE, NASDAQ, HKEX, ASX, LSE and DE with GO Markets as a Share CFD.
Sources: Lululemon athletica inc., TradingView, MarketWatch, MetaTrader 5, Benzinga, CompaniesMarketCap

JP Morgan Chase & Co. (NYSE: JPM) announced Q1 financial results before the market open in the US on Friday. The largest bank in the US beat both revenue and earnings per share (EPS) estimates for the first quarter of 2023, sending the stock price higher. The company reported revenue of $38.349 billion vs. forecast of $36.125 billion.
EPS reported at $4.10 per share vs. $3.414 per share expected. CEO commentary ''Our lines of business saw continued momentum in the quarter. In Consumer & Community Banking, consumer spending remained healthy with combined debit and credit card sales up 10% and card loans up 21%.
In the Corporate & Investment Bank, Markets revenue fell 4% versus a very strong prior year, and we focused on supporting clients as they navigated volatile market conditions. Global Investment Banking fees remained challenged for the industry, although we significantly outperformed the overall wallet. In Commercial Banking, we earned record revenue, with exceptionally strong Payments revenue, up 98%.
Finally, Asset & Wealth Management performed well with strong long-term inflows of $47 billion across products,'' JP Morgan’s CEO, Jamie Dimon commented on the latest results. Dimon also touched on the state of the US and global economy: ''The U.S. economy continues to be on generally healthy footings —consumers are still spending and have strong balance sheets, and businesses are in good shape. However, the storm clouds that we have been monitoring for the past year remain on the horizon, and the banking industry turmoil adds to these risks.
The banking situation is distinct from 2008 as it has involved far fewer financial players and fewer issues that need to be resolved, but financial conditions will likely tighten as lenders become more conservative, and we do not know if this will slow consumer spending. We also continue to monitor for potentially higher inflation for longer (and thus higher interest rates), the inflationary impact of continued fiscal stimulus, the unprecedented quantitative tightening, and geopolitical tensions including relations with China and the unpredictable war in Ukraine. While we hope these clouds will dissipate, the Firm is prepared for a broad range of outcomes, and we are confident that we can serve the needs of our customers and clients in all environments.'' ''Finally, I want to recognize our outstanding employees across the globe.
Thanks to their efforts, we extended credit and raised $588 billion in capital in the quarter for small and large businesses, governments, and U.S. consumers, as well as efficiently onboarded a significant amount of new clients across many of our businesses,'' Dimon concluded. The stock rose after beating Wall Street expectations. Shares were up by 7.55% at the end of the trading day on Friday at $138.71 a share.
Stock performance 1 month: +10.27% 3 months: -2.99% Year-to-date: +3.45% 1 year: +10.00% JP Morgan Chase & Co. price targets Barclays: $179 Evercore ISI Group: $146 Morgan Stanley: $153 RBC Capital: $132 Oppenheimer: $157 Wells Fargo: $155 Morgan Stanley: $173 Piper Sandler: $157 Deutsche Bank: $145 Barclays: $189 JP Morgan Chase & Co. is the 17 th largest company in the world with a market cap of $406.68 billion, according to CompaniesMarketCap. You can trade JP Morgan Chase & Co. (NYSE: JPM) and many other stocks from the NYSE, NASDAQ, HKEX, ASX, LSE and DE with GO Markets as a Share CFD. Sources: JP Morgan Chase & Co., TradingView, MarketWatch, MetaTrader 5, Benzinga, CompaniesMarketCap
The US Dollar Index (DXY) is a popular tool used by forex traders to assess the value of the US dollar relative to a basket of other major currencies. The DXY is calculated using the weighted average of six major currencies: the euro, yen, pound sterling, Canadian dollar, Swedish krona, and Swiss franc. To use the DXY to trade forex, you can follow these steps: 1.
Monitor the DXY: Keep an eye on the movements of the DXY to get a sense of the overall strength or weakness of the US dollar. You can use technical analysis tools, such as moving averages or trend lines, to identify the direction of the trend. 2. Analyse currency pairs Look for forex pairs that are inversely correlated to the DXY.
This means that when the DXY goes up, the currency pair goes down, and vice versa. For example, the EUR/USD pair is negatively correlated to the DXY, which means that as the DXY goes up, the EUR/USD pair goes down. Plan your trades Once you have identified a currency pair that is inversely correlated to the DXY, you can plan your trades accordingly.
For example, if the DXY is showing signs of weakness, you may want to consider going long on a negatively correlated currency pair, such as the EUR/USD. Manage your risk As with any trading strategy, it's important to manage your risk when using the DXY to trade forex. Make sure to use stop-loss orders to limit your losses in case the market moves against you.
Currency pairs may be influenced by other factors besides the DXY, which may not be a perfect indicator of the US dollar's value. To make informed trading decisions, it is important to combine the DXY with other technical and fundamental analysis tools.

Gold had been trading strongly to the upside since the beginning of March, rising from the 1810 price area to reach the 2000 price area which was last tested in April 2022. However, after reaching the resistance area, Gold retraced lower to test the 1937.50 support area which coincides with the 38.2% Fibonacci retracement level and the bullish trendline. Currently, Gold is forming a double top chart pattern as the price again retraces from the resistance level at 2000.
With the Moving Average Convergence and Divergence (MACD) indicator signaling a potential bearish reversal, a confirmation of further downside potential could be signaled if Gold breaks below the bullish trendline. This could see the price trade lower to test the 1917 level, and beyond that, the 1887 support level which coincides with the 61.8% Fibonacci retracement level. Significant moves to the downside on Gold is likely to be driven by a recovery in the strength of the DXY, due to its inverse correlation with the reserve commodity.
Alternatively, if the market uncertainty increases, arising from further developments in the banking crisis or increased concern over possible global inflation, Gold could trade higher beyond the 2000 resistance level, which would invalidate the double-top formation. A continuation of the uptrend could see Gold trade toward the next resistance level of 2070, which was last reached in March 2022.
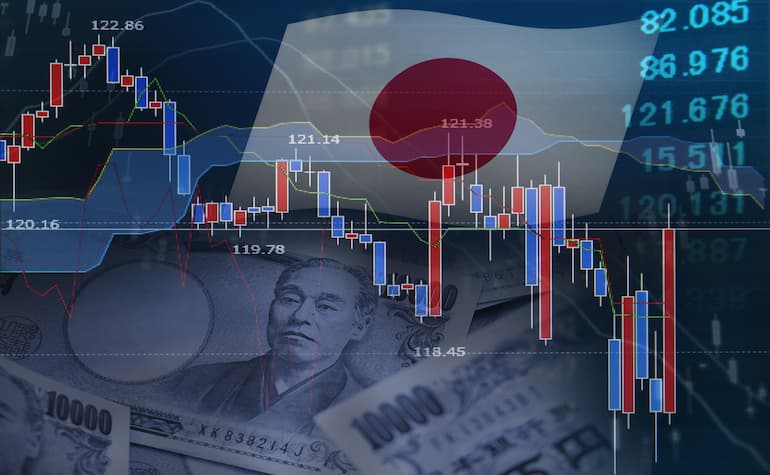
USDJPY The USDJPY is on the march higher again after a better than expected Non-Farm payroll figure on Friday saw sentiment shift hawkishly toward Fed monetary policy with Fed fund futures now pricing in a 70% chance of a 25bp hike at the FOMC May meeting, up from around a 50-50 split earlier in the week. The policy divergence in the US and Japan and the subsequent yield differentials on their respective 10 year government bonds has been the main driver of this pair in the last 12 months. You can see the close relationship of this in the chart below.
The black line is the difference between 10 year yields on US 10 years – Japanese 10 year years, the orange line, the USDJPY rate. As the US yields increase their gap to their Japanese counterparts, the USDJPY will be pressured upwards as traders look for low risk carry trades. The Yen was also not helped recently by comments from the new incoming governor of the BoJ that indicated that any change to the current dovish policy was not imminent.
Key levels to watch USDJPY has been forming a textbook uptrend since late March. With the upward trend line tested and holding as support on a handful of occasions, a resistance level of 133.85 has so far held any further upside, but is looking vulnerable. Ways to trade this are 1, Playing the range, buying low at the trendline, selling high at the resistance level.
Though whilst the uptrend is in place the more cautious approach would be to stick to buys. 2, Waiting for a break of these levels for the next push. The longer this takes, and the tighter the range gets the more explosive this move could be. While economic announcements out of Japan are very light on the ground this week, The US will be releasing both CPI and PPI figures, how these inflation figures look will have a measurable effect on market sentiment towards Federal Reserve policy and will almost certainly see some big moves in the USD and rates markets, so the break of this range may come as early as tomorrow night.
American manufacturer of farm machinery and industrial equipment Deere & Company (NYSE:DE) announced the latest financial results for the quarter ending January 29, 2023, before the market open in the US on Friday. Revenue was reported at $12.652 billion for the quarter (up by 32% year-over-year) vs. $11.337 billion expected. Earnings per share also topped analyst estimates at $6.55 per share vs. an estimate of $5.565 per share.
The company expects revenue of between $8.75 to $9.25 billion in the fiscal year 2023. CEO commentary ''Deere’s first-quarter performance is a reflection of favorable market fundamentals and healthy demand for our equipment as well as solid execution on the part of our employees, dealers, and suppliers to get products to our customers,'' CEO of the company, John C. May said in a press release. ''We are, at the same time, benefiting from an improved operating environment, which is contributing to higher levels of production,'' May concluded.
Stock reaction Shares of Deere were up around 5% at the market open on Friday, trading at $427.32 a share. Stock performance 1 month: -1.38% 3 months: -2.43% Year-to-date: -6.02% 1 year: +5.89% Deere & Company stock price targets Stifel: $477 Citigroup: $505 BMO Capital: $450 Wells Fargo: $485 Morgan Stanley: $522 Argus Research: $475 Credit Suisse: $582 JP Morgan: $440 UBS: $452 Deutsche Bank: $374 Goldman Sachs: $420 Citigroup: $425 Deere & Company is the 114 th largest company in the world with a market cap of $119.74 billion. You can trade Deere & Company (NYSE:DE) and many other stocks from the NYSE, NASDAQ, HKEX, ASX, LSE and DE with GO Markets as a Share CFD.
Sources: Deere & Company, TradingView, MarketWatch, MetaTrader 5, Benzinga, CompaniesMarketCap