
市场资讯及洞察

5 月伊始,联邦基金目标利率区间维持在 3.50% 至 3.75%。美联储刚刚结束了 4 月 28-29 日的议息会议,投资者正进入一个政策真空期,直至 6 月 16-17 日的下一次决议。然而,地缘政治背景远非平静。由于伊朗冲突导致霍尔木兹海峡处于事实上的关闭状态,布伦特原油价格已飙升至每桶 108 美元附近,国际能源署将其描述为“史上最大的能源供应冲击”。
本月的宏观矛盾既直接又令人不安:由能源驱动的通胀脉冲,正撞上 3 月份表现意外强劲的劳动力市场,而第一季度的增长数据却依然疲软。这种带有“滞胀”色彩的组合拳,直接挑战了美联储目前的政策路径。
美联储此前已将 2026 年 PCE 通胀预期上调至 2.7%,并继续暗示年内仅有一次降息,尽管市场对具体的降息时点仍持有异议。由于 5 月没有 FOMC 议息会议,每一项重磅数据的发布都将比往常承载更多的权重,成为投资者博弈 6 月政策走向的关键筹码。
经济增长:业务活动与需求
步入 5 月,经济增长的前景表现不一。第一季度 GDP 初步预览值已于 4 月 30 日公布,而此前疲软的零售销售和库存数据,使得整体需求端的局势变得更加难以捉摸。
ISM 制造业指数一直是乐观情绪的一个低调来源,近期的数值始终维持在扩张区间。然而,逆风的来源正在发生变化:能源成本和关税效应目前是决定业务活动下一步走向的最关键变量。对于那些已经在应对高昂投入成本的企业来说,108 美元的油价与贸易摩擦的结合,将是对企业韧性的一次重大考验。
劳动力:非农与就业数据
4 月的就业形势报告是本月最集中的风险事件之一。尽管 3 月非农数据强于预期,但此前的修正值使得整体趋势显得有些模糊。4 月的数据将起到决定性作用:揭示劳动力市场是在高利率背景下真正实现了“再加速”,还是仅仅在消化季节性噪音。
通胀:CPI、PPI 与 PCE
4 月的通胀数据是本月对市场影响最大的板块。3 月消费者价格指数 (CPI) 同比上涨 3.3%,其中能源成本月度上涨 10.9%,汽油价格飙升 21.2%,贡献了整体涨幅的近四分之三。鉴于布伦特原油在 4 月下旬维持在 105 至 108 美元之间,能源成本进一步传导至 4 月 CPI 几乎已成定局。尽管整体通胀数据引人注目,但核心 CPI 和核心 PCE 依然是研判美联储底层通胀趋势的关键指标。
政策、贸易与企业盈利
由于 5 月没有 FOMC 议息会议,政策关注点将转向美联储官员的讲话以及备受瞩目的领导层更迭。美联储主席杰罗姆·鲍威尔的任期将于本月中旬结束。唐纳德·特朗普总统已提名 凯文·沃什 (Kevin Warsh) 为下一任主席,市场正密切分析其听证会内容,以寻找央行独立性或政策倾向是否会发生转向的蛛丝马迹。
在地缘政治方面,已进入第九周的伊朗冲突仍是最大的宏观尾部风险。霍尔木兹海峡的封锁和停滞不前的美伊谈判为能源价格设定了较高的底部支撑。同时,第一季度财报季进入高峰期,预计 5 月 7 日将是报表发布最密集的一天,市场将重点关注零售和周期性行业如何应对利润率的挤压。
本月核心监控清单
- 美伊谈判: 关注霍尔木兹海峡运行状态的任何进展。
- 美联储语调: 官员在会议间隙期辞令的任何细微转变。
- 盈利质量: 尤其是零售、能源及周期性行业的表现。
- EIA 原油库存: 通过周度数据衡量国内供应缓冲情况。
- 关税公告: 任何可能推高通胀预期的贸易摩擦信号。
核心总结 (Bottom Line)
绝不能因为 5 月没有议息会议就认为这是一个平淡的月份。在 6 月决议之前,非农、CPI、PPI 和 PCE 数据将悉数出炉,而原油依然是主要的外源性冲击。对于市场而言,核心问题在于:我们面对的是一次暂时的能源驱动型通胀上升,还是在增长放缓的同时出现了一个更广泛的系统性通胀问题?这一区别将决定债券、美元、黄金及股指的下一个大级别走势。

Bollinger Bands are one of the most popular indicators that FX and CFD traders use, invented in the 1980’s they are a technical analysis tool that are widely used by short and long term traders. The main uses for Bollinger Bands is determining turning points in the market at oversold and overbought levels and also as a trend following indicator. Like any technical indicator Bollinger Bands should be used with your own analysis to confirm trades and help set entry and exit levels, they are a fairly simple indicator that focuses on price and volatility only and shouldn’t, in my opinion be used in isolation.
While effective, to use them successfully you will need to be aware of the fundamentals and other technical indicators such as major support or resistance levels. How Bollinger Bands are calculated Bollinger Bands are composed of three lines. The middle line is a simple moving average (SMA), the default period being 20.
The upper and lower bands are the SMA plus or minus 2 standard deviations by default, the SMA period and Deviations can be adjusted in the settings of the indicator if desired, but the standard settings are the most popular settings among traders. When the price hits the upper band the market could be seen as “overbought” when it hits the lower band it could be seen as “oversold”, they can also be used as levels where trends are confirmed, e.g. hitting upper band could be seen as the start of a strong uptrend and vice versa. Day Trading strategies using Bollinger Bands Bollinger Bands are used mainly in two different trading styles, for contrarians looking for overbought and oversold levels to enter fade trades, or confirmation of trend for trend following systems. Both systems have their pros and cons, as with most indicators it will depend on the market “fee” for the time used, a choppy whipsawing market will see the fading system work very well, a strong trending market will see the trend following system work very well.
As with any technical system, the selection of the market to trade and being aware of the fundamentals driving the FX market at that time are critical.. Just had a Fed meeting where they surprised with a 100bp rate hike? Don’t use the fade system on USD pairs!
A good technical system I have found is useful is a mixture of both of these strategies, using the Bollinger Bands to confirm a trend, then using the fading strategy to trade pullbacks of this trend. Lets look at the example below from the AUDNZD – 5 minute chart from the 23 rd March 2023 In the above example, which is a common price action across all FX pairs, you would be using the Bolling Bands to confirm a down trend after a close below a major low. Once the possible trend is confirmed, we will be using the “overbought” level of the upper band to enter a short trade, with a take profit exit on 2 closes below the lower band, indicating the market may have gone into “oversold” territory and was time to take some money off the table.
This process would be repeated while lower highs were being made, a close above a major recent high along with a close above the upper Bollinger Band would indicate the trend may have come to an end. This can be seen on the chart below, later in the session on the same pair. At this point you would exit the short selling of the down trend and reverse to a long bias, or if your analysis on fundamentals were negative for this pair, wait for a new downtrend to form for another shorting run.
The Bollinger Squeeze Strategy Another strategy popular with FX traders is known as the Bollinger squeeze strategy. A squeeze occurs when the price has a big move, then consolidates in a tight range, this also sees the Bollinger bands go from wide to “squeeze” in a much narrower range, hence the name of the strategy. A trader would be looking for a breakout and close below or above the Bollinger bands of this squeezed range for a trade entry, see the example below from the EURUSD 5 Minute chart on 23 rd of March 2023 When the price breaks through the upper or lower band after this period of consolidation a buy or a sell signal is generated.
An initial stop is traditionally placed just above (or below in a long position) the range of the consolidation. TP rules could be similar to the previous strategy, i.e. multiple closes below the lower Bollinger Bans in the case of a short, or using the middle Bollinger Band as a trailing stop in the move is explosive and looks to continue. Summary As you can see there are multiple uses for Bollinger Bands in a FX day traders toolbox, including using them for overbought and oversold trade signals in a trending market and the Squeeze strategy where an explosive move often follows a period of consolidation.
There are also many more strategies using this indicator which I encourage you to research for yourself.

BioNTech SE (NASDAQ: BNTX) reported Q4 2022 financial results on Monday. The German pharmaceutical company reported revenue of $4.563 billion for the quarter, topping analyst estimate of $3.897 billion. Earnings per share (EPS) also beat analyst estimates at $9.876 per share vs. $8.296 EPS expected.
CEO commentary ''We made significant progress in 2022 by advancing our pipeline and launching the world’s first Omicron BA.4/BA.5 adapted bivalent COVID-19 vaccine. In addition, multiple new modalities achieved encouraging clinical data and we progressed nine new programs into clinical trials,'' said professor Ugur Sahin, M.D., CEO and Co-Founder of BioNTech said in a press release. ''As we look to 2023 and beyond, we plan to continue investing in our transformation with a focus on building commercial capabilities in oncology and working towards registrational trials. Our mid-term goal is to seek approval for multiple oncology products in cancer indications with high unmet medical need,'' he added.
The stock was down by -3.59% at market close on Tuesday at $123.19 per share. Stock performance 1 month: -5.55% 3 months: -29.76% Year-to-date: -17.72% 1 year: -25.70% BioNTech SE price targets HC Wainwright & Co.: $210 JP Morgan: $142 Goldman Sachs: $156 Morgan Stanley: $216 B of A Securities: $239 SVB Leerink: $224 Canaccord Genuity: $192 BioNTech SE is the 576 th largest company in the world with a market cap of $29.99 billion. You can trade BioNTech SE (NASDAQ: BNTX) and many other stocks from the NYSE, NASDAQ, HKEX, ASX, LSE and DE with GO Markets as a Share CFD.
Sources: BioNTech SE, TradingView, MarketWatch, MetaTrader 5, Benzinga, CompaniesMarketCap
This week, the Bank of Canada (BoC) released its decision to hold interest rates at the current level of 4.50%. In the rate statement, the BoC indicated that inflation has eased to 5.9%, and the expectation for weaker economic growth and a moderation of wage growth could see inflation continue on its downward trajectory. The BoC highlighted that it projects that CPI inflation could reach the 3% level by the middle of the year, with core inflation reaching the target level of 2% in time to come.
Following the release of the decision, the Canadian Dollar weakened, with the USDCAD trading higher to test the 1.38 round number resistance level. This move higher was compounded by the recent strength of the DXY, a result of Fed Chair Powell’s testimony where he indicated that the Federal Reserve was ready to speed up rate hikes if the data warranted. The USDCAD could continue with the uptrend to trade significantly higher toward the next key resistance level of 1.39, especially if the US Non-Farm employment change to be released on Friday is stronger than expected.
However, it is likely that the USDCAD could first retrace briefly to the 1.37 price level, which aligns with the 23.60% Fibonacci Retracement level before a continuation to the upside. This brief retracement is also supported by the Relative Strength Index (RSI) as it indicates a likelihood to turn down from the overbought region.

This week, the Australian Consumer Price Index (CPI) y/y data was released at 6.8% (Forecast: 7.2% Previous: 7.4%) which signals a slowdown in inflation growth. In addition, the consecutive release of lower-than-expected CPI data highlights the possibility of a new trend of decreasing inflation for the Australian economy. With the view that inflation has peaked and is possibly on a downturn, the Reserve Bank of Australia (RBA) could decide to pause further rate hikes at its upcoming cash rate decision on Tuesday next week.
Keeping interest rates at 3.60% could lead to the AUDUSD trading slightly lower. The AUDUSD is currently trading between the key resistance level of 0.6765 and the support level of 0.6565, with the formation of a bearish pennant. If the AUDUSD maintains below the resistance level, look for a potential breakout to the downside, to retest the key support level of 0.6565.
This move lower could be driven by the recovery in strength on the DXY and if the RBA decides to hold interest rates at 3.60%.

The Consumer Price Index (CPI) is an inflation indicator that is closely watched by the markets and policymakers as a gauge of economic fluctuation and price stability. Generally, central banks set and adjust their monetary policy mandate in order to achieve a target level of 2-3% which would allow for moderate growth in prices. As the major economies emerge from the cloud of the Covid pandemic, the new battle is for the central banks to bring down inflation.
The Reserve Bank of Australia (RBA) began on its path of aggressive interest rate hikes in May 2022 as the Australian CPI had been climbing steadily to reach 6% by that same period. However, despite the rate hikes, inflation continued to rise to a peak of 8.4% in December 2022. This week, the Australian CPI y/y data was released at 7.4% which highlights an easing in inflation growth, potentially a lagging impact from the cumulate interest rate increases from the RBA.
Immediately following the release of the CPI data, the AUDUSD spiked down from the 0.6730 level to retest the round number key support level of 0.67. However, as the RBA has indicated that “further increases in interest rates will be needed over the months ahead to ensure that inflation returns to target”, the current slowdown in inflation growth could provide the RBA with more confidence that rate increases could lead to it achieving its target. As a result, sustained moves to the downside have been limited as the market anticipates another 25bps rate hike to come in the following week.
The AUDUSD currently trades under the 0.6780 resistance area which coincides with the 23.8% Fibonacci retracement level. Anticipating a bullish correction to the upside, as markets expect further interest rate increases, look for the price to break above the resistance level and the bearish trendline to trade higher toward the next key resistance level of 0.6870. This potential move higher is also supported by a crossover on the Moving Average Convergence Divergence (MACD).

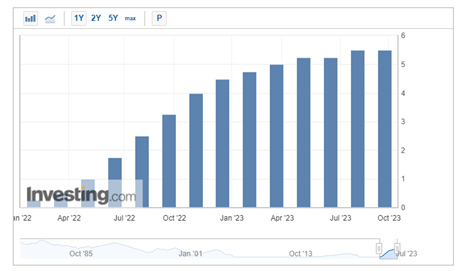
热门话题美东时间9月20日周三,美联储货币政策委员会FOMC会后宣布,联邦基金利率的目标区间仍为5.25%到5.50%,将政策利率保持在二十二年来高位。
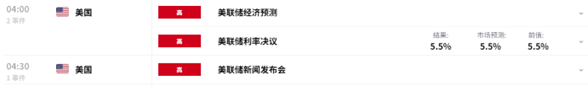
继今年6月后,这是美联储本轮紧缩周期内第二次未延续前次会议的行动继续加息。本次暂停加息符合市场预期。芝商所(CME)的工具显示,在美联储决议公布后前一日,本周二美国联邦基金利率期货交易市场预计,美联储本周按兵不动的概率接近100%,11月加息的概率不到30%,12月加息的概率约为40%。
尽管加息下的物价已开始如期下行,但是通胀卷土重来的担忧在近期油价飙升下加剧。目前美国方面经济数据仍有韧性,对于是否结束本轮加息周期仍然未能给出明确方向。因此美联储本次维持利率更多出于等待11月和12月更多经济数据,从而更好的决定下一次利率决策。会后美联储官员预期未来利率水平点阵图透出整体偏鹰,12名联储官员、六成以上官员预计今年内还有一次加息,多数都预计今年内还有一次加息。
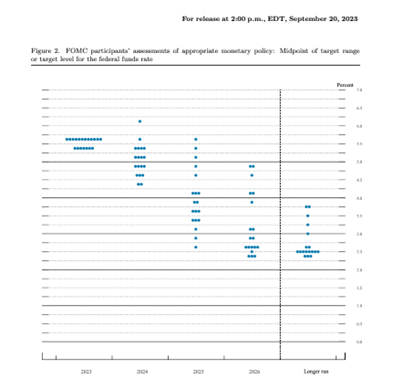
联储对明年的展望明显更为鹰派,对市场产生扰动,货币市场对11月加息的押注一度从29%升至31%。截至最新,芝商所(CME)的工具显示28.4%概率认为11月将加息25bp。

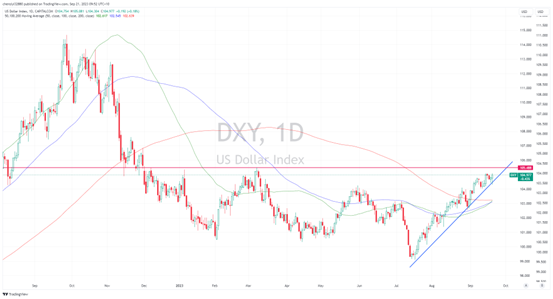
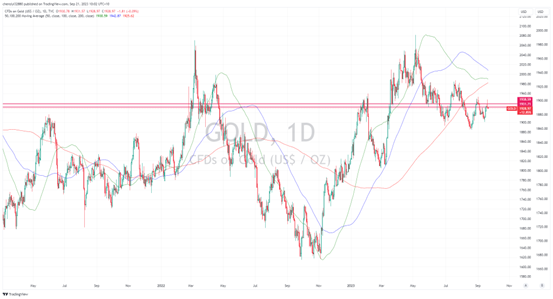
受消息影响,美元短线暴涨并逆袭当日跌势,黄金则自日内高位回撤逾10美元。美元指数由104.75一线迅速拉升40逾点至105.20附近,黄金则下滑数美元至1939。美元指数自7月99美元低点反弹以来,在200日均线之上形成稳步上涨趋势,涨幅已超5%。从昨日美联储利率决议的市场反应来看,美元短期内仍将延续强势,下一阻力位关注今年3月未能 突破的前高105.48美元。
黄金价格目前正挣扎在前阻力区间1932.71-1938.59下方,50日、100日及200日移动平均线都位于该阻力区间的下方,黄金突破上行较难。如果金价涨破这些均线并进一步上涨,下一目标将看向1885-1893以及更高的1900。长期来看,黄金看涨,近期黄金已经显示出易上行,缓下跌的态势。然而黄金上攻的势头被昨日偏鹰的美联储压制,短期内预计多空争夺,可在区间内寻找交易机会。
免责声明:GO Markets分析师或外部发言人提供的信息基于其独立分析或个人经验。所表达的观点或交易风格仅代表其个人;并不代表GO Markets的观点或立场。联系方式:墨尔本 03 8658 0603悉尼 02 9188 0418中国地区(中文) 400 120 8537中国地区(英文) +248 4 671 903作者:Cecilia Chen | GO Markets 分析师