
市场资讯及洞察
.jpg)
一、罕见的"4票反对":分裂房间里的最后一课
2026年4月29日,鲍威尔主持了他作为主席的最后一次FOMC会议。会议决议本身并不意外——联邦基金利率目标区间维持在3.5%—3.75%,符合市场近100%的预期。但真正震动市场的,是会议投票结果:8票赞成、4票反对,创下自1992年10月以来反对票数量最多的纪录。
这4张反对票呈现出戏剧性的"双向分裂"。被视为特朗普代言人的理事米兰投反对票,主张立即降息25个基点;而克利夫兰联储主席贝丝·哈马克、明尼阿波利斯联储主席尼尔·卡什卡里和达拉斯联储主席洛里·洛根则站在另一端,反对在声明中保留宽松倾向措辞。有财经记者尖锐地指出,本次决议暴露的不仅是政策分歧,更是美联储内部对未来路径的根本性分歧。
更具历史意义的是,鲍威尔在新闻发布会末尾留下了那句意味深长的告别——"非常感谢大家,下次不再见。"5月15日,他的主席任期将正式结束,由特朗普提名的凯文·沃什接任。但鲍威尔宣布将继续留任理事,"任期时长待定",此举将使继任者沃什的政策推进面临更复杂的委员会票数博弈。
二、PCE数据爆表:通胀回归"3字头"的警报
会议次日公布的PCE数据为美联储的鹰派立场提供了支撑,也将其困境暴露无遗。
3月PCE物价指数同比从2月的2.8%大幅跃升至3.5%;剔除食品和能源后的核心PCE通胀率从3.0%上升至3.2%——这是自2023年11月以来的最高水平。从1月核心PCE的3.1%,到3月的3.2%,再叠加整体PCE的3.5%,美联储2%的通胀目标已经渐行渐远。
通胀压力的来源结构正在发生根本性变化。一方面是2025年4月以来关税政策的滞后效应持续渗透至商品价格;另一方面,更直接的冲击来自2月底美国和以色列对伊朗发动军事行动后的能源价格飙升——汽油平均价格上涨约44%,WTI原油结算价单日大涨6.95%至106.88美元/桶,布伦特原油升至118.03美元/桶。鲍威尔在新闻发布会上承认,"高企的油价将在短期内推高整体通胀",并坦言美联储正在研究"关税只产生一次性价格影响"的假设。
三、GDP的"虚强实弱":增长引擎的结构性隐忧
与通胀数据同日公布的Q1GDP数据则呈现出"虚强实弱"的特征。第一季度实际GDP年化增长2%,较2025年Q4政府停摆拖累下的0.5%大幅反弹,但仍低于市场普遍预期的2.2%—2.3%。
拆解GDP构成可见三大特征:第一,消费支出增长1.6%,较Q4的1.9%继续放缓,反映出油价飙升和密歇根大学消费者信心指数跌至历史最低点的影响;第二,出口增长近13%(几乎全部由货物运输驱动),延续了2025年以来"抢出口"扭曲常态化的特征;第三,最值得关注的是非住宅固定投资增长10.4%,知识产权和设备支出尤为强劲——这背后是AI数据中心建设的"无止境需求"。鲍威尔在记者会上特别强调:"全美各地对数据中心的需求似乎永无止境"。
但这种"AI驱动+净出口扭曲+消费降温"的增长结构存在脆弱性。一旦AI投资周期出现拐点(如英特尔大跌17%所暗示的),或地缘冲突进一步升级压制消费,增长引擎可能快速失速。
四、政策路径:滞胀逻辑下的降息门槛抬升
综合三组信号——分裂的美联储、3.2%的核心PCE、2%的GDP增速——可以勾勒出货币政策的新框架:美联储正从"何时降息"的讨论,转向"是加息还是降息"。
对市场而言,这意味着三重压力:美元指数重回100上方对非美资产构成压制;美债收益率高位震荡延长"高利率长周期";风险资产的估值锚正在重新校准。
五、大类资产展望:股市、黄金、数字货币的三种命运
股市:AI叙事支撑下的"高位结构市"。 标普500、纳指在4月中旬连创新高,纳指100一度录得12连涨,但本次议息会议后美股反应分化——道指连续5个交易日下跌,标普微跌、纳指微涨,英伟达、微软等科技龙头跌超1%。这种分化揭示了市场的真实状态:AI数据中心建设的"永无止境需求"仍是核心引擎,但高利率环境下估值容忍度下降,叠加四大科技巨头财报的"AI验证时刻",资金正从无差别上涨转向严苛的业绩兑现筛选。
黄金:长期牛市未变,短期需警惕"滞胀对冲"与"获利了结"的拉锯。多空逻辑非常清晰:多头逻辑——核心PCE回到3.2%、地缘冲突未解、各国央行持续购金、美元信用受质疑;空头逻辑——美联储降息预期持续推迟、实际利率维持高位、黄金ETF高位出现净流出。机构展望分歧明显:高盛预测年底4900美元,摩根大通看到5055美元并维持2028年6000美元长期目标,但麦格理保守预测2026年均价仅4323美元。对普通投资者而言,黄金作为"滞胀对冲+央行去美元化"的中长期配置逻辑依然成立。
六、结语:货币政策的"历史性十字路口"
鲍威尔八年任期落幕,留下的是一份功过交织的账单——月均失业率4.6%创历史佳绩,但任内平均通胀3.09%远超2%目标。他的继任者沃什将接手一个更为复杂的局面:通胀粘性、地缘冲突、增长结构性脆弱、委员会内部的撕裂。在这个"供给冲击常态化"的新世界里,传统的需求管理框架正面临深刻挑战,资产配置的核心命题已从"押注降息节奏"转向"在滞胀阴影下寻找现金流和稀缺性"——这或许是鲍威尔留给市场最深刻的启示。


Tesla Inc. (NASDAQ: TSLA) reported its Q3 2022 delivery numbers on Sunday. World’s largest automaker delivered a total of 343,830 cars (up by 42.49% year-over-year) in the third quarter – setting a new quarterly record. The deliveries in Q3 consisted of: 18,672 Model S/X 325,158 Model 3/Y The automaker produced 365,923 vehicles in Q3. ''Historically, our delivery volumes have skewed towards the end of each quarter due to regional batch building of cars.
As our production volumes continue to grow, it is becoming increasingly challenging to secure vehicle transportation capacity and at a reasonable cost during these peak logistics weeks. In Q3, we began transitioning to a more even regional mix of vehicle builds each week, which led to an increase in cars in transit at the end of the quarter. These cars have been ordered and will be delivered to customers upon arrival at their destination,'' the company said in the press release.
Tesla will report its Q3 financial results after the closing bell on Wednesday, October 19, 2022. Tesla Inc. (NASDAQ: TSLA) chart Shares of Tesla were down by around 6% on Monday at $247.90 per share. Stock performance 1 month: -1.84% 3 month: +71% Year-to-date: -24.70% 1 year: +65% Tesla price targets JP Morgan: $153 Piper Sandler: $340 Deutsche Bank: $400 Wolfe Research: $360 Jefferies: $350 Morgan Stanley: $383 Wedbush: $360 Tesla is the 6 th largest company in the world and with a total market cap of $825.19 billion.
You can trade Tesla Inc. (NASDAQ: TSLA) and many other stocks from the NYSE, NASDAQ, HKEX and the ASX with GO Markets as a Share CFD. Sources: Tesla Inc., GO Markets MT5, Benzinga, CompaniesMarketCap
The Reserve Bank of Australia, (RBA) has surprised much of the market by raising the country's cash rate by just 25 basis points. With analysts expecting a more aggressive 50 bps hike, the smaller lift will provide relief to much of the country's housing market and equity market. RBA, Chairman, Phillip Lowe outlined how previous rate rises had already begun struggling with the previous rate rises.
International volatility has also become much higher with retirement funds in the UK needing to be bailed out by the Bank of England after the funds found themselves inundated with the liquidity issues due to spikes in yield on many of the UK government bonds that they were holding. With the global financial system so interconnected there was a very real chance that a trillion dollars’ worth of bonds would be exposed without intervention effecting far more then just the UK’s financial system. In addition, worries over both Deutsche Bank and Credit Suisse also being in trouble with their risk of defaulting potentially increasing.
This had the RBA worried that the situation could turn very quickly in Australia and sparked the lower rate. With relatively low rates of inflation the RBA has had more flexibility to adjust the aggressiveness of its hikes as it has gone along and todays changes showed that. The bank still expects inflation for the year to be between 6-7 %.
In response to the hikes the AUD dropped sharply on the news falling by 0.52%. Australian equities saw a large jump increasing by 0.93% for the half an hour after the announcement. With inflation still at elevated levels, there is no guarantee that the lower rate hikes will continue.
I have recently written a piece on the weakening of the Great British Pound (GBP) just the other day, as it looks like the dollar seems to be king at present and getting stronger against all other top currencies around the world. Today is the Chinese Yuan in focus, yesterday was the Sterling pound, who’s your money on tomorrow? We will have to wait and see on that front, but lets quickly dive into why is the Chinese Yuan falling to record lows against the dollar?
The offshore yuan depreciated past 7.2 per dollar, sinking to its lowest levels since data on offshore trading became available in 2011, dragged down by a strong dollar amid expectations for more Federal Reserve rate hikes and a widespread risk aversion in the markets. The yuan also weakened despite efforts by authorities to arrest its slide which are so far having limited impact. In the latest developments, the People’s Bank of China raised the foreign exchange risk reserves for financial institutions when purchasing FX through currency forwards to 20% from the current zero starting on Sept. 28th, making it more expensive to bet against the local currency.
A gloomy domestic outlook also weighed on China’s currency, with Nomura and Goldman Sachs slashing their 2023 economic growth forecast for China sharply, predicting Beijing will stick to its strict zero-COVID strategy well into next year. China’s yuan recovered slightly after falling to a 14-year low against the $$$ Wednesday despite central bank efforts to stem the slide after U.S. interest rate hikes prompted traders to convert money into dollars in search of higher returns. At one point, the yuan fell to 7.2301 to the dollar, its lowest level since January 2008.
One yuan was worth about 13.8 cents, down 15% from its March high. As you can see below, the FEDs strategy has reinforced strength in the dollar, a currency that has been rising to records highs, is now contributing to economic pains in various jurisdictions around the world making more expensive for countries such as China, Japan and UK to name a few, to spend more on importing and making their debt even harder to manage, as they also try to keep on top of inflation by raising interest rates which in turn puts off investors who are looking for value in the market; followed by a run on certain currencies as seen with the GBP to bring it to parity (well almost) with the USD. The Dollar Against the World Currencies (As of 16:40 AEST 29/09/2022) There have been ample opportunities to get involved in the FX markets of late, if it’s not buying the dollar, it is to sell other currencies against it, but tread carefully markets are volatile and a sense of trading responsibly must be heeded.
If you would like to study the trends and take advantages of entry opportunities, you can do so by opening an MetaTrader trading CFD account with GO Markets here or find our contact details in the footer below. Sources: fortune.com, tradingeconomics.com

热门话题
周五美国8月核心物价指数出炉后,数据比预期还差,大大降低了11号9月CPI的乐观预期,美联储11月加息75个基点的概率大增。市场对美国经济衰退的担忧越发严重,多头抛售潮还在继续,道指标普已经破位今年新低,只有纳指还在最低位置挣扎。在这样的行情下,成长股成为首要杀估值对象,很多业绩股也是自身难保,往日的明星板块已经星光不在。

在股市普跌的大环境下,反弹愈发艰难,不知道何时才能出现持续性的反弹,对于熊市的时间估计,目前仅不到之前入熊平均时间的一半,预计还有最少八个月的熊市时间。对于指数下跌空间,目前仅跌去平均熊市回撤的五分之三,三大股指均还有一定幅度的下跌空间。筛选各大板块,当下可以选择的美股代码少之又少,考虑到澳洲矿业出口为主的结构,利用俄乌战争加剧全球能源危机的大背景,加上美国主导遏制油价控制通胀,欧洲主导遏制天然气价格控制物价,传统能源煤炭成了香悖悖。特别是北半球进入下半年,入冬在即,煤炭将是当下必需的资源,由此选出的澳洲煤炭板块中的佼佼者WHC,成为少有的有机会在今年最后三个月依然可以绽放光芒的股票代码。

WHC目前市值81亿,52周从最低$2.12攀升到了$9.33,股息收益率超过5%,市盈率低于5,每股收益接近$2,换手率较低,综合各方面都不失为优秀的持有选择。从公司基本面看,2022年主营业务收入中露天开采占比接近70%,是绝对的主力,地下开采占比近20%。主要客户几乎均在亚洲,其中日本占比超过52%,中国台湾占比近15%,韩国和印度合起来接近20%,印尼占4.4%,其他少许欧洲和澳洲本地市场占比非常低。这还是受到中澳煤炭贸易限制的情况下交出的业绩报表。公司2022年净利润接近20亿,同比增长了458%,因此今年股价也是翻了好几倍。同时负债率降落到了31%,比往年都有所下降。目前现金流超过25亿,是2021年的17倍。从22年财报显示,公司22年总资产收益率37%,资本回报率43%,净资产收益率达到了惊人的56%。从股东持股看,截止8月中,JPMorgan持有超过7%股份占据榜首,其中也不乏Blackrock和Vanguard的身影。

从WHC的技术面看,周线均线排序清晰,趋势一致向上,尽管近期有过短暂大回撤,但长下影线基本消化回撤风险,K线呈强势多头上涨形态,MACD阳柱暴力拉长,目前还在一个强势期,双线差距依旧在加大过程中,并没有出现回落信号。成交量处于十分平稳的状态,就算上周股价的大起大落也没有过多影响成交量的起伏。SAR斜率向上升高,周线显示还在愈发强势过程中,关键指标MA10周线和股价距离不断拉大,保持继续上涨态势。整体上看WHC是少有的今年最后几个月大行情不乐观情况下依然可以逢回落可以进场并且有较大胜算的股票,更是煤炭板块中的明星,是可以短时间看到收益效果的股票,在目前的大环境下优先级别远高于其他原来的明星板块。WHC估值在$11左右,目前处于被低估状态,评级为强力买入级别。免责声明:GO Markets分析师或外部发言人提供的信息基于其独立分析或个人经验。所表达的观点或交易风格仅代表其个人;并不代表GO Markets的观点或立场。联系方式:墨尔本 03 8658 0603悉尼 02 9188 0418中国地区(中文) 400 120 8537中国地区(英文) +248 4 671 903作者:Xavier Zhang | GO Markets 专业分析师

热门话题
AMD 期待了两年的 zen4 架构 Ryzen 7000 系列终于来了。
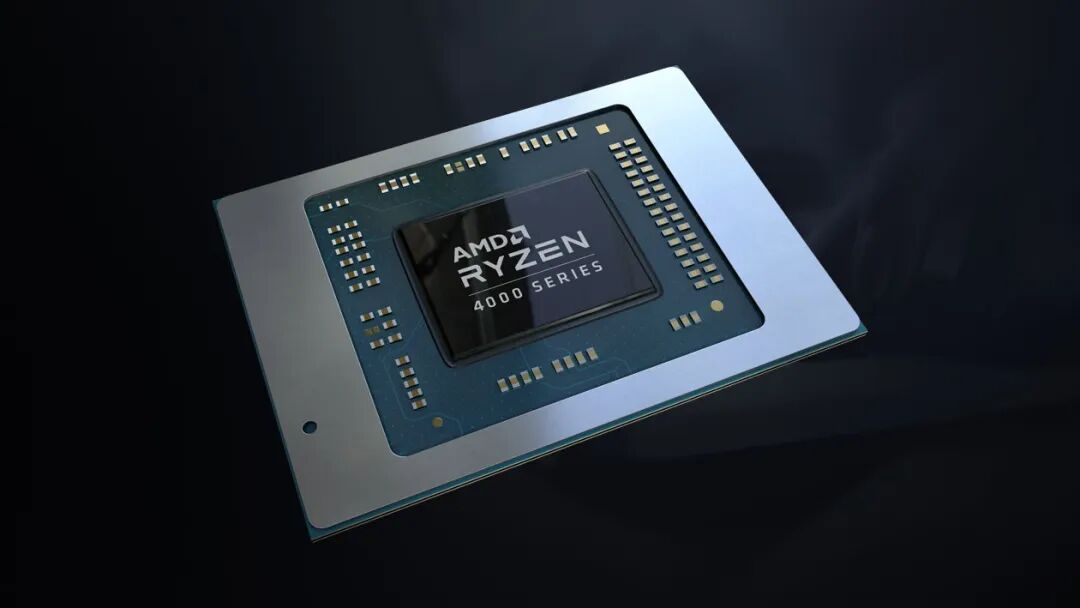
作为一个经历了红绿争霸(AMD VS NVIDIA)和红蓝之争(AMD VS Intel)的人。从zen2 架构开始,也是见证了AMD的崛起。2019年Zen2 架构的横空出世,让大家看到三代Ryzen 有多么好用。架构层面的突破,随之而来的就是性能的暴增。AMD 一直以来的高性价比策略为其营造了很好的口碑。再加上三代Ryzen 无论是旗舰端,还是中高端,以碾压的姿态打败了9代Intel cpu,也同样的干掉了10代的Intel。继而来到了新一代的Ryzen 5000系列。第四代的锐龙Ryzen 延续了上一代的凶猛势头,在性能上比起上一代提升了xxx,不仅如此,11代Intel 也是被5000系列的CPU完全击败。也正是这两代产品的高调问世,阻止了Intel系列的cpu继续挤牙膏。无论是价格还是性能,大家都在高呼“AMD YES”。因此才有了12代Intel 的超亮眼表现,不过这也是后话了。在两年之后,AMD终于推出了新一代(第五代)的 Ryzen 7000 系列产品。老实说,因为前面两代的提升实在是太巨大了,所以人们对于这代产品期待会有些过高,也有人觉得干不掉12 代 的Intel cpu 就是不合格的。理性点说,12代Intel 可不是前几年挤牙膏的产品,想要这代干翻,可能性其实不大的,我觉得就是比起上一代有不错的进步就够了。那么就来看一看,这一代产品的表现如何。首先看看这一代的改变,这一代的改变第一就是外观上,新一代的外观感觉炫酷了不少,有种蒸汽朋克的感觉。规格上从zen3变为了zen4 架构,工艺从台积电7nm换到了5nm,新的AM5接口。
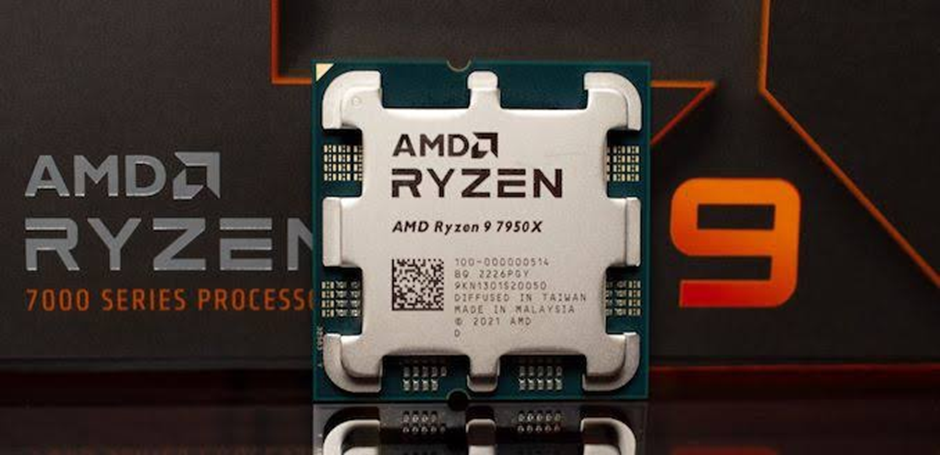
(source:AMD)作为7nm到5nm的工艺改变,那么首当其中的就是可怕的频率,在这代中的7950x频率单核达到了5.7Ghz,全核来到了5.1Ghz。这个数值看的我热血沸腾,想一想上一代5950选材到4.9Ghz,简直像个重磅炸弹,频率是已经追上了Intel 的步伐。值得一提的是,这代7000cpu 中,居然配置了核显了,也就是不买独显,平常办公也够了?这不变相打压一波老黄?接下来就是性能表现了,发布会上AMD宣城的IPC提升是13%,但是我看了下各个测试视频数据,并没有达到那么高。那么这里不得不解释一波,什么事IPC。IPC的英文名称是Instruction Per Clock,中文是每个是每个时钟指令,大致意思就是每个时钟周期下,执行了多少的指令。通常来说,其中CPU性能的公式为性能=IPC*频率。比如说,大家都在4.0Ghz的主频下,IPC提升10,%,也就是CPU性能提升了10%。那么举个例子说明一下,一个工厂进行机械化制作,每次运转可以做10个磨具(IPC),一分钟可以运转5次(频率),那么一分钟就做出来50个磨具(性能)。当工艺改进后,每次运转可以做11个磨具(IPC增加10%),一分钟后做了55个。这样就性能就提高了10%。那么zen2升级到zen3 时候,IPC提升了18%!这么爆炸的提升,隔壁牙膏厂当时想都不要想好吧。因此,在这代Zen4 大家也是给了期待。但是似乎,IPC进步的没想象中那么大?不过呢,这次zen4 架构的高频还是让理论性能比起上代增加了20% 左右。属实效果不错。游戏性能上比起5000系列也有显著提升。不过比起12代酷睿,还是无法打败,这个呢,我相信很多人难免会比较失望吧。其中得提一提,其中上代的5800x3d的游戏性能真是很棒,让我不得不在想,明年会出7800x3d吗?如果有,那么我一定会去入手。Zen4 的创作方面性能,7000系列在专业软件中比起上一代提升挺大,特别是7950x,但是除了7950x,其他的和12代酷睿没有太多优势,考虑到13代酷睿即将发售,不禁也是为AMD捏了把冷汗。
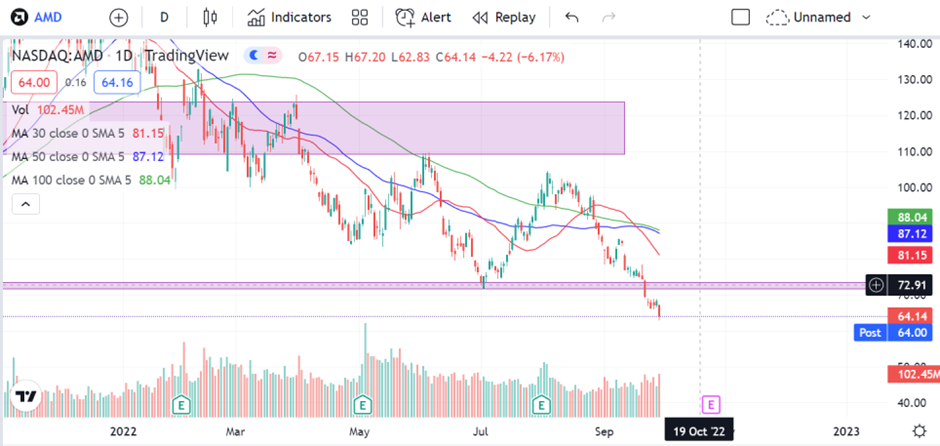
(source:AMD)最后一个就是功耗,发布会上就可看到,其功耗较低了60%, 看了极客湾测评,在同频下,和上代相比,功耗的确是降了60%,性能增加,功耗降低,低碳环保,这点倒是做的很不错,电费也省了不少。总结来说呢,性能比上代提升较大,但是没有完全干掉12代酷睿,相信大家还是会有些失望。因此,在新产品发布之后,AMD的股价并没有太大的上升,因为预期给的足够高,这次新产品并没有达到甚至超过预期。技术面来看,AMD股价已经跌破了区间带70-73下方有着不少的空间。如果AMD股价要回到原来的节奏上,势必需要先突破70-73阻力带。最后,我们也展望一下AMD下一代显卡会不会给我们带来更多的惊喜。
免责声明:GO Markets分析师或外部发言人提供的信息基于其独立分析或个人经验。所表达的观点或交易风格仅代表其个人;并不代表GO Markets的观点或立场。联系方式:墨尔本 03 8658 0603悉尼 02 9188 0418中国地区(中文) 400 120 8537中国地区(英文) +248 4 671 903作者:Neo Yuan | GO Markets 助理分析师
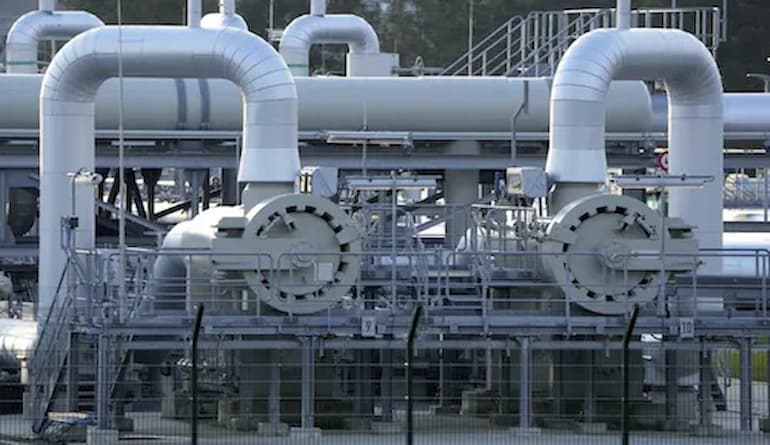
Natural Gas prices have had a volatile year to say the least. After finding multi decade highs on the back of geo-political volatility and record high inflation levels the price has seen an aggressive retracement. With the overall commodities market suffering a big drop as recessionary pressures have taken over and a resilient USD, Natural gas has seen a 30 per cent drop from its peak.
News about leaks in the Nord Stream 1 Pipeline and Russia's control over much of the rest of Europe's supply has seen an increase of volatility and with Europe entering winter soon and the surety of supply still on a knifes edge, the market remains volatile. Looking at the recent price action of Natural Gas, the long-term chart shows that the current price is sitting on a strong area of support at 6 USD. Not only is the price sitting on a strong area of support, the area also doubles as the 200-day average.
The weekly candle is a Doji showing indecision as buyers and sellers look to find the equilibrium price. By comparing both the RSI from the weekly and daily charts its can be observed that there is interesting divergence of patterns. On the weekly timeframe, the RSI is consolidating into a symmetrical triangle whilst the daily RSI shows a bounce off the oversold zone.
This may provide a clue as to which direction the price may go next. If the price continues to bounce off the oversold level, it may indicate a longer-term break on the weekly chart. This bounce would provide an obvious target for a reversal to the long side to the top of the range at 10 USD.
With general market volatility still quite high and commodities seeing aggressive moves, the next 6-12 months may provide some interesting trading opportunities for natural gas in both directions.