
市场资讯及洞察

Markets enter May with the federal funds target range at 3.50% to 3.75%, the Fed having concluded its 28-29 April meeting, and the next decision not due until 16-17 June. Brent crude is trading near US$108 per barrel, with the IEA describing the ongoing Iran conflict as the largest energy supply shock on record as the Strait of Hormuz remains effectively closed.
The macro tension this month is straightforward but uncomfortable: an oil-driven inflation impulse landing into a labour market that surprised to the upside in March, while Q1 growth came in soft.
The Federal Reserve has revised its 2026 PCE inflation projection to 2.7% and continues to signal one cut this year, though the timing remains contested. With no FOMC scheduled in May, every high-impact release may carry more weight than usual into the June meeting.
Growth: business activity and demand
The growth picture entering May is mixed. The Q1 GDP advance estimate landed on 30 April, while softer retail sales and inventory data have made the demand picture harder to read.
ISM manufacturing has been a quieter source of optimism, with recent prints holding in expansionary territory. Energy costs and tariff effects are now the variables most likely to shape the next move in business activity.
Labour: payrolls and employment data
The April Employment Situation is one of the most concentrated risk events of the month. March payrolls came in stronger than expected, while earlier data revisions left the trend less clear. April will help show whether the labour market is genuinely re-accelerating or simply absorbing seasonal noise.
Inflation: CPI, PPI and PCE
April inflation lands as the most market-relevant data block of the month. The March consumer price index (CPI) rose 3.3% over the prior 12 months, with energy up 10.9% on the month and gasoline up 21.2%, accounting for almost three quarters of the headline increase. With Brent holding near US$105 to US$108 through the latter half of April, a further passthrough into the April CPI energy component looks plausible.
Core CPI and core personal consumption expenditures (PCE) remain the better read on underlying trend.
Policy, trade and earnings
May has no FOMC meeting, so policy attention shifts to Fed speakers, the path of any leadership transition, and the dominant geopolitical backdrop. Chair Jerome Powell's term concludes around the middle of the month. President Donald Trump has nominated Kevin Warsh as the next Fed chair, with the Senate Banking Committee having held a confirmation hearing.
The Iran conflict, now in its ninth week, remains the single largest source of macro tail risk, with the Strait of Hormuz blockade and stalled US-Iran talks setting the tone for energy markets and broader risk appetite. Q1 earnings season is in its peak weeks, with peak weeks expected between 27 April and 15 May, and 7 May the most active reporting day.
What to monitor this month
- Iran-US negotiations and the operational status of the Strait of Hormuz
- Fed speakers and any change in tone between meetings
- Q1 earnings, especially from retail, energy and cyclical names
- Weekly EIA crude inventories
- Any tariff-related announcements that may affect inflation expectations
Bottom line
May is not a quiet month just because there is no FOMC meeting. Payrolls, CPI, PPI, retail sales and PCE all land before the June policy decision, while oil remains the dominant external shock.
For markets, the key question is whether the data points to a temporary energy-driven inflation lift, or a broader inflation problem arriving at the same time as softer growth. That distinction may shape the next major move in bonds, the US dollar, gold and equity indices.

Major Asian stock indexes are following the lead from Wall St where US stocks finished broadly lower in a choppy, low volume session as economic news disappointed, Fed talking heads remained hawkish and a mixed batch of earnings. The ASX200 and Nikkei down around 0.24% while the Hang Seng down just over 0.5 a % FX Markets Have mostly continued with US dollar strength, the Aussie and Kiwi dollars have both declined against the greenback in the Asian session so far. The Aussie dollar is looking to test the 0.67 level where it found support yesterday, and the Kiwi dollar in similar action looking to also test yesterdays lows at 0.6150.
Both the Aussie and Kiwi suffering from a risk off mood to the markets on the weak economic data released in the US overnight. The JPY is bucking the USD strength trend though with a Hotter than expected CPI figure released today supporting the Yen as well as safe haven flows. core inflation came in at 3.1% vs 3% expected. We also have a BoJ meeting next week, the first for the new governor and one where we may get a hawkish surprise regarding The BoJ policies going forward which seems to be adding to Yen strength. commodities Gold has modestly declined this morning, but holding just above the 2000 USD an ounce level where there has been a real battle between the bulls and the bears the last few days and will be an important level to watch going into tonight's US and European session.
World’s largest company Apple Inc. (NASDAQ: APPL) announced the latest financial results after the market closed in the US on Thursday. After disappointing results last quarter, the company bounced back in the fiscal 2023 second quarter ended April 1, 2023, topping revenue and earnings per share (EPS) estimates. Company overview • Founded: April 1, 1976 • Headquarters: 1 Apple Park Way, Cupertino, California, United States • Number of employees: 164,000 (2022) • Industry: consumer electronics, software services, online services • Key people: Arthur D.
Levinson (chairman), Tim Cook (CEO), Jeff Williams (COO), Luca Maestri (CFO) The results Apple reported revenue of $94.836 billion for the quarter vs. $92.906 billion expected. Revenues were up down by 3% from the same period last year. EPS reported at $1.52 per share (unchanged year-over-year) vs. $1.429 per share expected.
The company announced a dividend of $0.24 per share. CEO commentary "We are pleased to report an all-time record in Services and a March quarter record for iPhone despite the challenging macroeconomic environment, and to have our installed base of active devices reach an all-time high," Apple’s CEO, Tim Cook said in a letter to investors. "We continue to invest for the long term and lead with our values, including making major progress toward building carbon neutral products and supply chains by 2030," Cook concluded. The stock was down by just shy of 1% at market close on Thursday at $165.77 a share.
Share price rose by around +2% in after-hours following the latest results. Stock performance • 1 month: +0.69% • 3 months: +9.93% • Year-to-date: +27.60% • 1 year: +5.75% Apple price targets • Rosenblatt: $173 • Baird: $180 • B of A Securities: $173 • Deutsche Bank: $170 • Barclays: $149 • JP Morgan: $190 • Wedbush: $205 • Credit Suisse: $188 Apple is the largest company in the world with a market cap of $2.640 trillion, according to CompaniesMarketCap. You can trade Apple Inc. (NASDAQ: APPL) and many other stocks from the NYSE, NASDAQ, HKEX, ASX, LSE and DE with GO Markets as a Share CFD.
Sources: Apple Inc., TradingView, MarketWatch, MetaTrader 5, Benzinga, CompaniesMarketCap, Wikipedia
American Express Company (NYSE: AXP) announced first quarter financial results before the market open on Thursday, setting a new quarterly revenue record. Company overview Founded: March 18, 1850 Headquarters: New York, United States Number of employees: 77,300 (December 2022) Industry: Banking, financial services Key people: Stephen J. Squeri (Chairman & CEO), Jeffrey C.
Campbell (Executive VP & CFO) The results American Express reported revenue that broke all previous quarterly records at $14.281 billion (up by 16% from the same period last year) vs. $13.981 billion expected. Earnings per share (EPS) reported at $2.40 per share (down by 12% year-over-year), falling short of analyst estimate of $2.656 per share. CEO commentary ''Our first-quarter results reflect strong growth in Card Member spending and continued high engagement with our premium products, tracking with the full-year 2023 guidance we provided in January, which we are reaffirming today, for revenue growth of 15 percent to 17 percent and earnings per share of $11.00 to $11.40,'' Stephen J.
Squeri, Chairman and CEO of the company said in a press release to investors. ''Revenue grew 22 percent from a year earlier to reach a quarterly record, as Card Member spending rose 16 percent on an FX-adjusted basis. Travel and Entertainment spending was particularly robust, growing 39 percent on an FX-adjusted basis and in March, we saw a record level of reservations booked on our Resy restaurant platform. We also saw an acceleration in spending in our International Card Services segment, which increased 29 percent on an FX-adjusted basis.
Spending on Goods and Services around the globe grew 9 percent on an FX-adjusted basis.'' ''Our customers have been resilient thus far in the face of slower macroeconomic growth, elevated inflation and higher interest rates, with credit performance remaining best-in-class. That said, we’re mindful of the mixed signals in the external environment.'' ''Based on our performance to date and the momentum we see in our business, we remain confident in our ability to achieve our longer-term growth plan aspirations,'' Squeri concluded. The stock was down by around -1% on Thursday at $162.41 per share.
Stock performance 1 month: -0.26% 3 months: +10.54% Year-to-date: +9.87% 1 year: -12.60% American Express price targets SVB Securities: $220 Piper Sandler: $179 BMO Capital: $197 Citigroup: $152 Jefferies: $170 American Express is the 109 th largest company in the world with a market cap of $120.91 billion, according to CompaniesMarketCap. You can trade American Express Company (NYSE: AXP) and many other stocks from the NYSE, NASDAQ, HKEX, ASX, LSE and DE with GO Markets as a Share CFD. Sources: American Express Company, TradingView, MarketWatch, MetaTrader 5, TipRanks, CompaniesMarketCap, Wikipedia

USD was firmer on Tuesday amid a light news calendar sparse in any key risk events. The US Dollar index again having a choppy session in a tight range with EURUSD weakness giving the Dollar a tailwind, also helping the greenback was ramped up US growth forecasts from Goldman Sachs and the World Bank hitting the wires. EUR was the G10 underperformer to see EURUSD hit lows of 1.0668 before finding support at a Fib level, this following a miss in German Industrial orders and an ECB consumers survey showing a sharp decline in inflation expectations.
Adding to the dovish tone was comments from ECB member Knot (a known hawk) who made some dovish comments declaring “the worst of inflation is behind us”. More ECB talk is scheduled for Wednesday which could add to this narrative. CAD managed to eke out some gains against the Dollar in a whipsawing session, USDCAD seeing a low low of 1.3391, breaching the key support level at 1.34.CAD was initially weighed on by lower oil prices, but an improved growth outlook saw Crude oil rebound with the CAD following suit.
Later today CAD traders will have all eyes on the BoC rate decision where the Central Bank is expected to hold rates at 4.5%, but there is a distinct possibility of a 25bps hike in the wake of the recent beats on GDP and CPI readings. Current market pricing has a 46% chance of a hike priced in, so will be line ball. GBP and JPY were modestly higher against the USD on the session.
JPY pared some of its initial strength by a rise in UST yields widening the UST-JGB differential. GBPUSD traded within a tight range, printing a low of 1.2392 and a high of 1.2458. Weak home building figures and a rising recession fear capping gains on cable as the BoE's aggressive rate hiking campaign appears to be slowing the economy.
AUD was the clear G10 outperformer after the RBA surprised the market again with a 25bps hike to 4.10%, which along with a hawkish RBA statement noting further rate hikes “may be required” seeing AUDUSD hit a high of 0.6685, falling just short of the 200DMA at 0.6692 and holding most of the gains post announcement throughout the session. For AUD watchers today Q1 GDP will be released today at 11:30 AEST, though it could have limited impact given the RBA already opted to hike rates yesterday. Calendar of today’s major risk events:
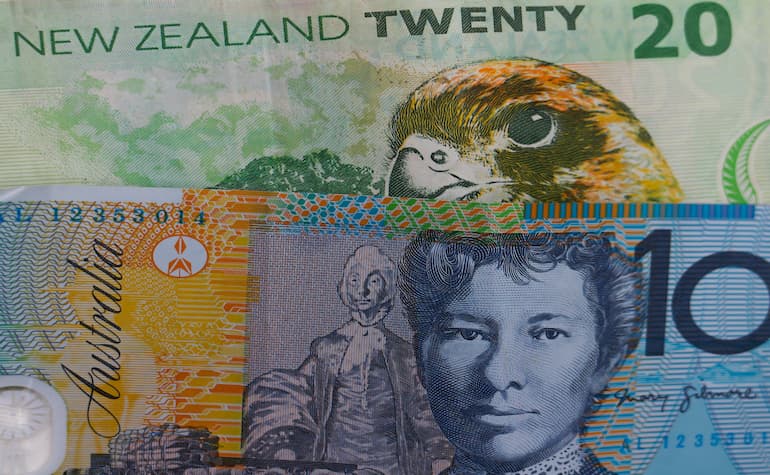
AUD and NZD, being cyclical currencies (cyclical currencies being ones that are extra sensitive to global risk sentiment) took a big hit in Fridays session, dropping 1.1% and 1.3% respectively against the USD and remain under pressure today. Weak retail sales out of the US on Friday didn’t help risk sentiment, but the rout really started when the USD soared on hawkish comments from Fed governors, (Waller being the most forceful) which saw rate hike odds at the next Fed meeting push significantly higher. Both the Aussie and Kiwi dollars have suffered from a shift in market pricing for continuing rate hikes in the United States and Europe, with Fed Funds futures now showing an 80% chance of another Fed hike in May and flirting with the risk of a 50bp hike from the ECB as both banks Governors continue to talk tough on inflation.
AUDUSD AUDUSD is technically still in an uptrend with an upward sloping trend line still in place, AUD was helped along by stellar employment figures out of Australia last week, though the forcefulness of the rejection at the 0.68 USD resistance zone on Friday does put into question how much legs this short-term uptrend has. Traders looking to enter the AUDUSD need to keep these levels in mind, a break and hold of the major 0.68 resistance could signal a push higher and resumption of the uptrend, a solid break through the short term trend would likely see the AUDUSD test 2023 lows before finding much buying. NZDUSD The Kiwi is showing similar price action to AUDUSD, with its major resistance and an area of a real battle between the Bulls and the Bears just above the psychological 0.63 level, with some short term support around the 0.6170 level.
There was a major rejection of the 0.63 level on Friday, in similar price action to the AUD, this also pushed NZDUSD below its 100 Day SMA (which has now turned on a downward trajectory) and just holding above its support zone. Like the AUD, a break below this support zone could see the Kiwi test the 2023 lows around 0.6080 before seeing buyers come back in, any push above 0.63 is likely to see some pushback and volatility in the NZDUSD pair. AUDNZD Despite higher yields in New Zealand the AUDNZD pair has rallied strongly in recent days, helped along by some small pricing in of a RBA hike next month after the strong jobs report.
The pair has now risen well into the 1.08’s after pushing below its 10-year median of 1.07 earlier in the month, showing that AUDNZD continues to be a good buy under this level. In economic news out of Australia, the RBA Minutes form the last RBA meeting will be released tomorrow, which could give clues as to whether the hold is temporary or not, plus NZ CPI figures will be released on Thursday. Inflation figures have been very important in recent times as indicators of Central Bank actions, so we could see some excitement on this figure.
The Aussie dollar has been fairly directionless since late February with it seemingly waiting for a catalyst to break it’s ranges and take the next leg up or down, data this week has failed to provide that. This opens up a couple of very good opportunities for traders, range trading the AUDUSD and mean reversion trades on the AUDNZD. Starting with AUDUSD, we’ve seen a very strong and tight range develop between a high of 0.6818 to a low of 0.6564 since late February, with the AUD moving in unison with risk sentiment, recently a push lower in this pair has been driven by US debt ceiling concerns, and haven flows into the USD.
Using an equidistant four-part grid the buy and sell zones to take advantage of this range trading opportunity become clear. While this range continues, buying in the green zones and selling in the red zones has so far been very successful. This looks likely to continue while the aforementioned US debt ceiling impasse remains in place, though traders will need to be on top of any developments, a resolution is likely to see risk roar back and the AUD take a leg up.
The other opportunity is the relative underperformance of the AUD vs its close neighbour, NZD. This has seen AUDNZD drop below its 10 year mean of 1.07, giving mean reversion traders an opportunity to buy this pair at a discount. Weekly chart of AUDNZD, showing how this mean reversion trade has worked over the last 8 years.
To help with entries, a shorter time frame chart can be used, below is the 4-hour chart showing a strong support zone has formed between 1.0650 – 1.0580 during the last month, where price has tested on multiple occasions before moving back to the 1.07 level. These are two of my favourite trading styles I’ve used over the years, but as always, have an exit plan and keep aware of macro happenings if you are looking to incorporate this style of trading into your toolbox. AUDUSD – US debt ceiling negotiations AUDNZD – RBA and RBNZ rate expectations