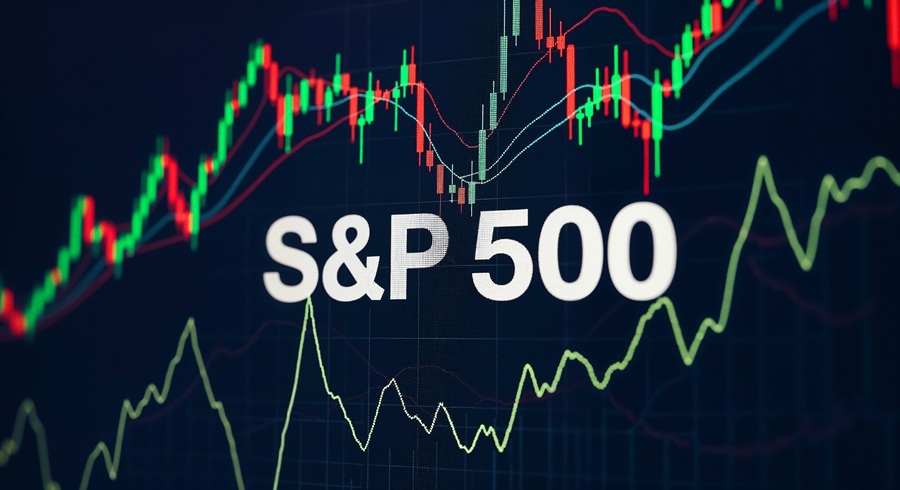
Analyse how the S&P 500 connects to global markets. Track inverse correlations with gold and the VIX, and discover how US equity risk moves the AUD/USD.
The S&P 500 is the most-watched number in global finance. Watching the number without understanding what is inside it and what is driving it is like reading a headline without the story.
The S&P 500 is a market-capitalisation-weighted index of 500 large US companies that functions as the world's most widely watched measure of risk appetite. A rising index does not always mean the whole market is healthy. Knowing the difference is what separates a trader from a scoreboard watcher.
When the S&P 500 rises, it generally signals that investors are confident and willing to take on risk (risk-on). When it falls sharply, it signals fear and a global reduction in risk exposure (risk-off).
What the S&P 500 actually measures
The S&P 500 measures the performance of 500 large publicly listed companies in the United States, selected by a committee to represent the broader economy.
Traders do not buy the index directly; instead, they access it through CFDs typically labelled as SPX or US500, through ETFs like SPY, or via index futures. While it tracks 500 separate businesses, the final output is a single number that traders monitor tick-by-tick to gauge the health of US equities.
Tracks the performance of the largest publicly traded companies in the US, selected to represent the broader domestic economy.
BROAD MARKET PROXYTraders access the index through derivative products like CFDs (SPX, US500), physical ETFs (SPY), or index futures contracts.
TRADABLE INSTRUMENTSWhy a few stocks drive the whole index
The most important structural concept to understand about the S&P 500 is market-capitalisation weighting. The index is not an equal-weighted average. The largest companies by market value exert a disproportionately massive influence over the index's total level.
If a small group of large technology stocks accounts for 25% of the index's total weight, a 5% surge in just those five stocks will push the entire index up by more than 1%, even if the other 495 stocks do absolutely nothing. This is not a flaw in the index; it is simply how it works.
This creates a severe concentration problem. When a handful of mega-cap growth companies dominate the returns, the index can rise sharply while the majority of the 500 companies are flat or falling. Understanding this mechanism is vital to reading the S&P 500 accurately.
Beyond being a list of stock prices, the S&P 500 serves as the world's most widely used measure of US and global risk appetite. Even traders who never touch US equities directly use it as a signal.
For Australian traders, this connection is incredibly direct. When you wake up and check the news before the Sydney session begins, the S&P 500 overnight move is one of the first things that matters. The sentiment established by the SPX sets the tone for risk assets globally.
What moves the S&P 500
The S&P 500 is driven by five core macroeconomic forces.
Earnings season (four times per year) is the most direct driver of index moves.
Companies report profits above expectations: revenue is growing, margins are holding, and forward guidance is positive.
Earnings disappoint when profits miss estimates, companies cut guidance, and margins are squeezed by costs or falling demand.
The most important macro driver. The index is highly sensitive to central bank expectations.
When rate cut expectations rise, lower rates reduce the discount rate on future earnings, making stocks relatively more valuable.
When rate hike expectations rise, higher rates increase the discount rate, reducing the present value of future earnings (especially growth stocks).
Strong growth supports corporate revenues, but the relationship is not always linear.
GDP growth is strong, unemployment is low, and consumer spending remains robust.
Recession risk rises, GDP slows, or leading economic indicators deteriorate severely.
The S&P 500 is the world's primary risk-on and risk-off barometer.
Investors are confident, geopolitical risks are contained, and global credit markets are stable.
Fear rises, credit spreads widen, and investors actively reduce their risk exposure globally.
Many S&P 500 companies earn a significant share of revenues outside the US.
When the US dollar weakens, overseas revenues of multinationals translate back into more S&P 500 dollars.
When the US dollar strengthens sharply, overseas revenues translate back into fewer dollars, pressuring reported earnings.
How the S&P 500 connects to the markets you trade
Because the S&P 500 acts as the ultimate measure of risk sentiment, its moves cascade across every other major financial asset:
The S&P 500 and gold often move in opposite directions. When the S&P 500 falls sharply due to fear, gold often rallies as safe-haven demand increases. However, if the S&P 500 falls specifically because of rising interest rates, gold can fall simultaneously since higher rates pressure both assets.
The Australian dollar is highly risk-sensitive. When the S&P 500 rises broadly on genuine risk-on sentiment, the AUD/USD pair often benefits. When US equities fall during risk-off periods, the AUD tends to fall with them.
In a classic equity-bond rotation, investors fleeing a falling S&P 500 move their capital into the safety of bonds, pushing bond yields down and bond prices up. During an inflation shock, however, both equities and bonds can suffer at the same time.
The VIX measures expected volatility on S&P 500 options and tends to move inversely to the index. When the S&P 500 falls sharply, the VIX spikes. When US equities rise steadily, the VIX falls.
Australia's ASX 200 takes significant cues from the S&P 500 overnight session. A strong or weak close in the US typically influences the direction of the ASX 200 open the following morning.
When the S&P 500 moves most
To effectively monitor the S&P 500, pay close attention to specific periods and macroeconomic releases that trigger immediate institutional repricing:
-
Earnings season: Occurs four times a year and directly drives index valuations via massive corporate profit reports.
-
Central bank meetings: Fed rate decisions directly alter the discount rate applied to future corporate profits.
-
CPI & NFP data: Inflation data and employment prints trigger immediate volatility because they dictate future rate expectations.
-
The opening & closing bells: The first and last 30 minutes of the New York trading session are typically the most liquid and volatile periods of the day.
The S&P 500 is not just a list of 500 stocks. It is a market-cap-weighted snapshot of global risk appetite.
Before trading an index breakout or breakdown, always check if the move is being driven by corporate earnings, shifting interest rate expectations, or a sudden change in global risk sentiment.
Test your knowledge

The information provided is of general nature only and does not take into account your personal objectives, financial situations or needs. Before acting on any information provided, you should consider whether the information is suitable for you and your personal circumstances and if necessary, seek appropriate professional advice. All opinions, conclusions, forecasts or recommendations are reasonably held at the time of compilation but are subject to change without notice. Past performance is not an indication of future performance. Go Markets Pty Ltd, ABN 85 081 864 039, AFSL 254963 is a CFD issuer, and trading carries significant risks and is not suitable for everyone. You do not own or have any interest in the rights to the underlying assets. You should consider the appropriateness by reviewing our TMD, FSG, PDS and other CFD legal documents to ensure you understand the risks before you invest in CFDs.