
市场资讯及洞察
.jpg)
自GPT点燃人工智能产业浪潮以来,全球资本市场的叙事重心几经转移。从最初的核心算力芯片,到高带宽存储,再到电力与散热基础设施,每一个阶段都有相应的硬件赛道成为市场焦点。而当前,聚光灯正照向一个曾经相对边缘的环节——光通信与光模块。而这轮的炒作也是AI硬件演进至2026年后物理极限倒逼的必然结果。理解这一逻辑,有助于把握当前AI产业链的核心瓶颈所在。
一、算力瓶颈的递进:从“算力荒”到“互联墙”
回顾AI硬件投资的脉络,每一次瓶颈的转移都催生出一批核心受益标的。
2023年:算力荒。 大模型密集发布阶段,最稀缺的资源是算力芯片。英伟达的GPU与掌握CoWoS先进封装产能的台积电,成为产业链的绝对核心。
2024年:内存墙与电力墙。 算力提升后,数据传输速度成为新的制约因素;同时,大规模集群运行带来显著的电力负荷压力。HBM(如SK海力士)和液冷温控(如维谛技术)解决方案因此迎来高速增长。
2025-2026年:互联墙。 这是当前阶段的核心瓶颈。AI算力集群已从万卡级别扩张至十万卡级别,GPU之间的数据交换量呈指数级增长。网络连接一旦拥堵,庞大的算力投资将无法有效释放。如何实现GPU之间的极速互联,便成为光通信产业链成为超级主线的底层逻辑。
二、光模块的核心驱动力:从“按年迭代”到“按月推进”
在超算中心内部,光模块承担着连接GPU的“数据通道”功能。其爆发式增长可归纳为三大核心驱动力:
(一)铜缆的物理极限。 在传统的短距离传输中,铜缆尚可胜任。但在当前800G甚至1.6T的超高传输速率下,铜缆的有效传输距离受到严格限制。在长距高速互联场景中,“光进铜退”已成为不可逆转的技术方向。需要说明的是,在机架内极短距离互联场景下,铜缆方案依然具备成本和低功耗优势,如英伟达GB200 NVL72即采用高速铜缆背板互联方案,铜缆连接数量高达5,184根。不过,随着GPU集群规模的持续扩大,铜缆在高速条件下的传输距离限制日益凸显,光通信方案的重要性正在快速提升。
(二)高速迭代与市场规模跃升。 在传统通信时代,光模块速率从100G提升至400G往往耗时数年。而在AI时代,云厂商直接以订单推动交付节奏。据Lightcounting测算,2026年全球光模块数据通市场规模预计达228亿美元,2026至2030年复合增速约为20%。中金公司指出,2026年全球光模块已进入800G全面普及、1.6T规模商用阶段,头部厂商中际旭创与新易盛已启动1.6T光模块的小批量出货。高端新品订单消化速度较快,叠加硅光方案带来的BOM成本下降,推动相关企业毛利率稳中有升。
(三)硅光子与CPO:技术迭代的下一阶段。 为满足高带宽、低功耗的系统需求,硅光子技术和光电共封装方案正成为产业格局重构的重要方向。银河证券数据显示,2026年800G光模块中硅光方案占比已超过50%,而在1.6T光模块中占比高达70%—80%。传统EML光芯片路线产能集中于海外,受限于磷化铟材料,2026年供给缺口较大,硅光方案成为缓解供应链压力的关键路径。与此同时,中金公司认为CPO已成为推动产业链新一轮升级的核心变量。
三、产业链格局:核心环节的定价权分布
在美股、A股与港股市场中,光通信产业链涉及多个细分环节,掌握核心定价权的公司各有侧重。
(一)美股:底层芯片与关键元器件的供应方
博通(Broadcom -AVGO)。 博通是光模块中DSP(数字信号处理器)芯片的核心供应商之一。高端DSP赛道呈现博通与Marvell双寡头垄断格局,双方凭借深厚的SerDes IP积累和PAM4编解码算法,几乎垄断了头部云厂商的1.6T DSP供应份额。1.6T主流方案中博通200G DSP表现较为突出,其400G DSP已发布上市,技术优势明显。但需注意,DSP先进制程芯片高度依赖台积电先进封装产能,台积电的产能排期直接影响高速光模块的放量节奏。
迈威尔科技(Marvell -MRVL)。 Marvell通过收购Inphi进入DSP市场,是博通在这一领域的主要竞争对手。在1.6T DSP供应格局中,Marvell与博通共同构成双寡头垄断。
Astera Labs(ALAB)。 该公司专注于PCIe Retimer芯片,解决单台服务器内部GPU与CPU之间的数据拥堵问题。其Aries PCIe重定时器产品线已被整合进英伟达Hopper平台,服务于主要美国超大规模数据中心客户。
(二)A股:封装与量产能力的集中地
中际旭创(300308.SZ)。 中际旭创是全球光模块领域的龙头供应商,其核心竞争优势在于新品导入能力和量产良率控制。从产业链动态来看,英伟达、谷歌、微软等全球顶级科技公司均在光通信领域展开积极布局,中际旭创作为核心供应商深度受益于这一趋势。公司800G光模块产品市占率连续两年位居全球第一,硅光技术的渗透率已超过一半。
天孚通信(300394.SZ)。 天孚通信在光器件领域拥有领先的精密封装和集成能力,是全球光器件行业的重要供应商之一。公司1.6T相关光引擎业务持续向好,已实现1.6T光引擎的规模量产。在前沿技术领域,公司前瞻布局CPO配套光器件,储备有高密度多通道FAU、ELS外置光源模组等核心产品,并持续布局硅光等下一代技术路线。
新易盛(300502.SZ)。 新易盛是光模块领域的另一家核心供应商,已具备800G及以上光模块的规模化量产能力,并成功批量交付最新一代1.6T产品。公司正积极推进3.2T、6.4T及12.8T等更高速率产品的研发。
(三)港股和相关企业
鸿腾精密(06088.HK)。 鸿腾精密业务中高速铜缆背板连接方案是机柜内短距离互联的有效路径之一。其增长受益于算力集群内部互联需求,但在光通信核心产品领域布局相对有限,与A股光模块龙头公司的主体业务存在差异。
长光华芯、索尔思光电等。 在EML光芯片领域,国内光芯片企业正在加速突围。长光华芯、索尔思光电具备IDM能力,正快速推进高端EML的送样与量产,成为填补海外供给缺口的重要力量。
四、展望:光通信之后的市场焦点
当光模块环节的认知趋于成熟,AI硬件演进的下一阶段或将引领资本市场的新一轮方向
端侧推理芯片:大模型推理请求若全部依赖云端处理,网络延迟与电力成本将面临较大压力。推进AI向终端迁移、实现本地推理已成为产业共识。端侧推理芯片有望迎来规模化落地的关键窗口期。
先进封装基板: 当前AI芯片封装面积不断扩大、功能复杂度持续提升,已逐步逼近有机基板的物理极限。玻璃基板具备低热膨胀系数、高平整度、低翘曲、高密度布线等优势,有望成为先进封装的下一个关键材料,延续封装密度和集成规模的进一步提升。从技术进展看,英特尔于2026年CES发布了首款采用玻璃核心基板进行量产的Xeon 6+处理器,苹果也已开始测试先进玻璃基板用于AI服务器芯片。台积电正加速推进玻璃基板与FOPLP融合方案,并计划于2026年建成迷你产线。
具身智能硬件: 大模型若缺乏物理交互能力,将无法完全作用于物理世界。当AI开始尝试与环境发生交互时,高精度六维力矩传感器、无框力矩电机、行星滚柱丝杠等机器人核心零部件也将随之迎来大规模资本涌入的重要拐点。
结语
从算力芯片到存储,从散热到互联,AI硬件瓶颈的每一次转移都带来新的投资主线。光通信与光模块作为当前“互联墙”环节的核心受益领域,其产业景气仍处于上行通道。中长期来看,端侧推理、先进封装与具身智能硬件亦是值得关注的方向。
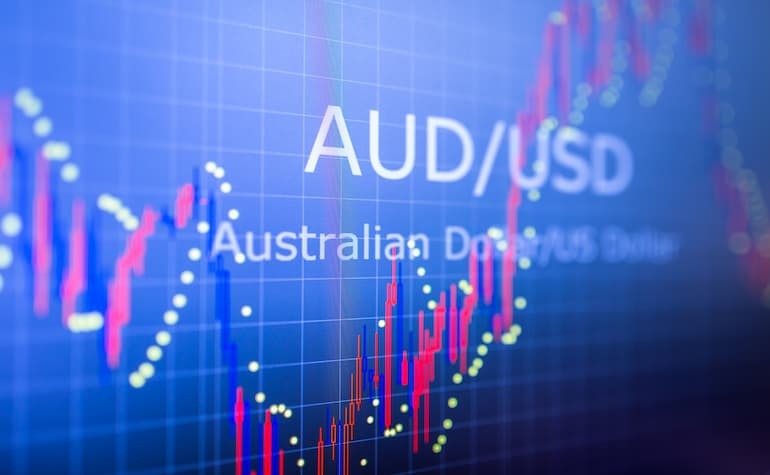

The Australian Consumer Price Index (CPI) y/y was released at 6.3%, lower than the market forecast of 6.5% and from the previous data of 6.8%. With inflation growth on a clear downtrend following its peak of 8.4% in January 2023, this is likely to reduce the need for further rate increases from the Reserve Bank of Australia (RBA). The Australian cash rate is currently at 3.60% with the RBA anticipated to keep with the previous decision of holding rates steady next Tuesday (2nd May).
While the RBA has previously indicated that some further tightening may be needed to ensure that inflation returns to target, the decision to keep interest rates at 3.60% or comments regarding a pivot in future decisions could lead to further weakening in the AUDUSD. Following the release of the CPI y/y data, the AUDUSD traded lower, breaking out of the channel, and signaling a possible continuation of the downtrend since February 2023. Additionally, with the Ichimoku cloud acting as a resistance and indicating further downside potential, the AUDUSD could trade down to retest the support level of 0.6565.
Beyond the immediate support level, the next key support level is the previous swing low at the 0.64 price area. This move lower could be driven by a further recovery in strength on the DXY and if the RBA decides to hold interest rates at 3.60%.

The Bank of England (BoE) is due to release its interest rate decision today, with markets expecting a 12th consecutive hike to take interest rates to 4.50%. There has been increasing speculation that the BoE is reaching its terminal rates and could follow the lead of the US FOMC and the ECB in signaling a slowdown or pause on further rate hikes following the decision today. However, inflation in the UK is yet to signal a sustained slowdown, with the recent March Consumer Price Index (CPI) still above 10%.
The UK economy has been performing better than expected this year, which has seen the GBPUSD rise steadily to trade just below the key resistance area of 1.27, which was last tested in May 2022. Any indication that the BoE could potentially pause on monetary tightening or dissent in the voting (expected 7-0-2) on the rate hike could see the GBPUSD come under renewed downward pressure. A bearish divergence (prices rallying to new highs while the oscillator retraces from a peak) has formed at the resistance level and could signal the potential for a reversal to the downside.
This reversal could be confirmed if the GBPUSD continues to trade lower past the 1.2550 price level, which coincides with the 38.2% Fibonacci retracement level from the short term. The downside on the GBPUSD could be significant, with the next key support level at 1.2350 which aligns with the 38.2% Fibonacci retracement level from the longer term.

In the most recent meeting, the US Federal Reserve hiked rates by 25 basis points, as anticipated, to take interest rates in the US to 5.25%, slightly beyond the terminal rate of 5.1%. However, the US Dollar Index (DXY) fell to the key support level of 100.80 which was last reached in April and February 2023, following the release of the rate hike decision. The DXY trading lower was driven primarily due to comments from Chair Powell where he indicated that the Federal Reserve was “closer to the end than the beginning” and that it “felt like they are close, or even there”.
This signaled to the market that the Federal Reserve could pause on future rate hikes, leading to the weakness seen on the DXY. In the lead-up to the Federal Reserve rate decision, the upside on the DXY was limited by the round number resistance area of 102 and the 200-period moving average (200 MA). With the DXY approaching the key support level of 100.80 and the relative strength index (RSI) heading down toward the oversold region, watch out for the development of price action along the support level.
If the DXY continues to trade lower the next key support level is at 100 which was last tested in April 2022.

Following the lead of the US Federal Reserve, the European Central Bank (ECB) announced its decision to hike rates by 25 basis points, taking interest rates in the Eurozone to 3.75% overnight. In the lead-up to the ECB meeting, there was some market speculation for a potential 50bps hike, which saw the EUR/USD trade to a 12-month high, reaching the 1.1095 price area. During the press conference, President Lagarde highlighted that the ECB was not pausing on future rate hikes, but she indicated some “uncertainty in policy transmission” and that it was “sensible to return to more standard increment”.
This led to the EUR/USD reversing strongly to trade lower and retest the 1.10 round number support level. As the EUR/USD continues to fluctuate between the 1.10 and 1.11 price level, further upside potential could be limited, with the key resistance level at the 1.12 price area. If the DXY recovers in strength, look for significant correction to the downside on the EUR/USD with the next key support level at 1.08.
However, confirmation for the downward move would be signaled only if the price breaks below the crucial level of 1.095 which is a confluence of levels with the 23.60% Fibonacci retracement, short-term upward trendline, and the 200 moving average.

Crude Oil has always been one of the most popular and highly traded markets for CFD traders whether it is WTI or Brent, especially recently as geopolitical and economic forces have seen its price fluctuate from extreme lows to extreme highs. It’s easy to see why, Oil is a bellwether for the health of the global market, oil greases the wheels of global commerce and with CFDs it’s possible to take a position in this exciting market, whether you think the price will head up or down. In this CFD Oil trading Article we will look at the following: How to use CFDs to trade oil Fundamental forces that drive the price of oil Popular technical strategies for trading oil CFDs How to use CFDs to trade oil CFDs or Contracts For Difference allow you to speculate on the price of oil, without owning the underlying asset.
A spot oil CFD tracks the price of the spot market being the cleanest and most efficient way to speculate on the price of oil. They also allow you to take a position in both directions, you would enter a buy (Long) positions if you believed the price will rise, or a sell (Short) position if you believe the price will fall. With Long positions you are looking to buy and sell at a higher price at a later time to profit on the trade.
With a Short position you are selling with the view to buy back at a later time to profit on the trade. At GO Markets we offer our clients the worlds most popular oil trading platform in Metatrader 4 and 5, another advantage to these CFD trading platforms is the ability to automate oil trading strategies. Other advantages to trading oil CFDs with GO Markets: Trade 23 hours a day on WTI oil, 21 hours a day on Brent oil, unlike an ETF or oil company listed on a stock exchange that is only open while that stock exchange is open.
Leverage – the margin required to open the trade will be a fraction of the face value of the position depending on what leverage you are comfortable with. Flexibility in position sizing starting from 0.1 lot ($0.10 USD per point movement in oil) unlike oil futures which have rigid contract sizes. Rolling contract, no expiries such as in options or futures to worry about.
To Enter a position in Metatrader, you would bring up a deal ticket by clicking “New Order” then select your position size, any Stop Loss or Take Profit levels you want the position to automatically close at and hit Buy or Sell. As with any instrument, make sure you are familiar with the lot sizing. 1 standard lot in oil (USOUSD and UKOUSD) is 100 barrels, or $1 USD a point so make sure you set the volume to a level commensurate to your account size and risk appetite. Now, the next question is how you decide on a buy or sell, let’s look at the fundamentals of what drives oil and some technical analysis you can use to answer this question.
Fundamental forces that drive the price of oil Both WTI oil (USOUSD) and Brent Oil (UKOUSD) are highly correlated and will both be referenced as “oil” in the below. While no one reason can be fully attributed to movements in the price of oil, there are an important few fundamental drivers that will influence the price and whose relationship has been time tested. None of these on their own should be used as a sole reason to enter a position, but having the fundamentals on your side will certainly give you an advantage.
The main fundamental drivers in my experience are The perceived health of the global economy OPEC+ production cuts or increases Geopolitical issues The perceived health of the global economy Oil is the driver of commerce, it is needed for the transport and manufacturing of goods and getting people around. If economic conditions are deteriorating, it means less economic activity and the need for less oil sending the price down. A global economy which is seen as “hot” means more economic activity and more demand for oil, seeing it’s price increase.
A clear chart to see this is the price of oil as compared to the US 10-year bond yield over the years. You can see the price of oil and the yield are highly correlated, this is due to yields going up when the economy is “hot” and yields falling when the economy enters a period of contraction, similar price drivers to oil. The black line is WTI oil price, the orange US 10-year yields going back 10 years.
Source: tradingview.com OPEC+ production cuts or increases The Organization of the Petroleum Exporting Countries (OPEC) is a cartel of leading oil-producing countries formed in order to collectively influence the global oil market. OPEC started with a handful of Middle Eastern oil producers in 1960, and has since grown to 24 members in OPEC+. Even thought the USA is currently the worlds top oil producer, OPEC+ countries as a whole still dominate global oil supply and decisions made by the cartel can have a dramatic influence on the price of crude oil.
Market share of oil producing nations: Source: gisreportsonline.com OPEC+ hold regular meetings during the year, normally the expected result is well telegraphed, but sometimes there can be a surprise, such as at their latest meeting on Sunday April 2 nd, 2023, where a surprise production cut was announced, seeing the price of oil gap significantly higher on Mondays open, showing oil traders to always approach these meetings with caution. Geopolitical issues The last three years has seen some very influential geopolitical events, or “black swans” and oil being closely tied to the health of the global economy has seen some very big moves on the back of these events. The Pandemic and its related lock downs and slowing of global commerce saw the price of oil slump to all time lows, followed by the war in Ukraine which saw oil jump to multi year highs on the fear of supply disruptions (Russia is the second biggest oil producer in the world) The chart below illustrates this: Oil traders especially need to be aware of geopolitical risks as the above chart shows.
Technical strategies for trading oil CFDs While having a good understanding of the fundamentals (in my opinion) is important to help you choose the best trades most traders will use a combination of technical analysis and fundamentals with the aim for higher probability outcomes in their trades. Some traders will use technical analysis exclusively without any interest in the fundamental drivers using things such as RSI oscillators, support and resistance areas and trend lines solely to decide on their trade direction. Which option is best is solely up to the trader, their time frames for the trades and risk appetite, all can work, and all can fail neither option can be seen as “better” than the other, it all depends on the individual trader.
Technical analysis is an art in itself and there is a lot to learn on this subject, I encourage anyone interested to research the many weird and wonderful technical analysis strategies that are documented online. But let’s take a look at a popular technical indicators that oil traders use to make their trades. Support and Resistance Support and resistance are one of the most widely used and accurate (when used correctly) technical indicators that can be used by traders.
Support and Resistance areas are points in the market where the price is held from going lower (Support) or going higher (Resistance), these are areas where buyers or sellers are entering the market as they see value in the asset at that price. These levels can last a long time or be temporary and can be used to predict turn arounds in the market, or a break of these levels could indicate a further push in that direction. Oil is also particularly sensitive to psychological levels around “big figures” or rounded number, e.g. 79.00 and 74.00 As can be seen on the chart below.
Hopefully this article has given you an interest to learn more about trading oil with CFDs. Feel free to contact the GO Markets team if you have any questions on trading oil CFDs and opening an account with us.

The Australian interest rate is currently at 3.85% and the most recent consumer price index (CPI) released at 6.8% which indicates slightly higher than expected inflation growth (expectation was 6.4% with previous data at 6.3%). This puts more focus on the upcoming interest rate decision from the Reserve Bank of Australia (RBA). While further rate hikes could apply added pressure onto the economy as households face increasing mortgage repayments, on the other hand, the series of previous rate hikes have not signaled that inflation growth is likely to slow down sustainably towards the RBA’s target level.
Market analysts are split between a hawkish hold (keeping rates at 3.85% while signaling a possible hike in the 3rd quarter, depending on further data) or continuing with another hike of 25bps to 4.1%. With the AUDUSD currently trading along the 0.66 price level, a hawkish interest rate decision from the RBA could see the AUDUSD break above the resistance at 0.6650, formed by the 200 moving average. The expected price action could be similar to that seen following the RBA’s surprise decision to hike rates by 25bps at the May meeting.
In this scenario, the AUDUSD could trade toward the immediate key resistance level of 0.68 with further sustained upside likely to depend on the volatility of the DXY.